VMware vSphere

 View Only
  • 1.  Monitoring WMware with Zabbix

    Posted Aug 11, 2023 11:52 PM

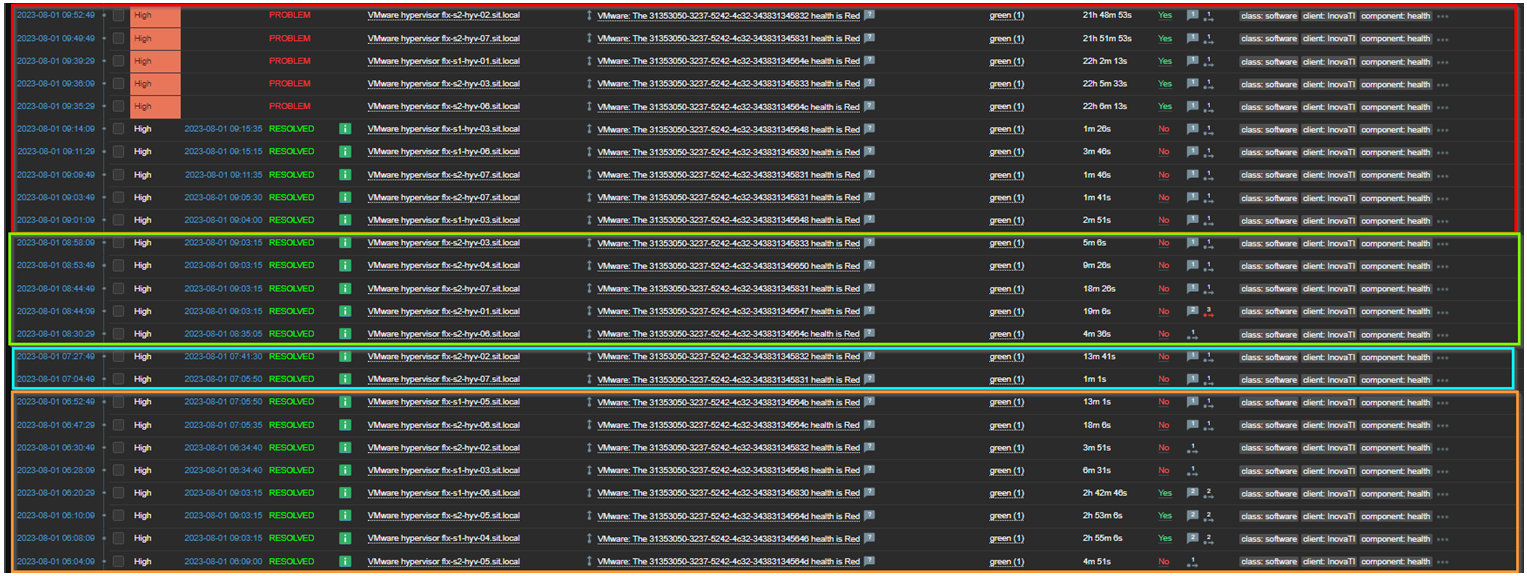
    I have a VMware cluster being monitored through Zabbix, using the VMware Hypervisor template and currently I have received many alerts with the trigger: VMware: El 31353050-3237-5242-4c32-34383134564d health is red, alerts that are resolved without intervention.

    lbasso_1-1691797840629.png


    Analyzing the Zabbix documentation I see these details:

    lbasso_0-1691797809648.png

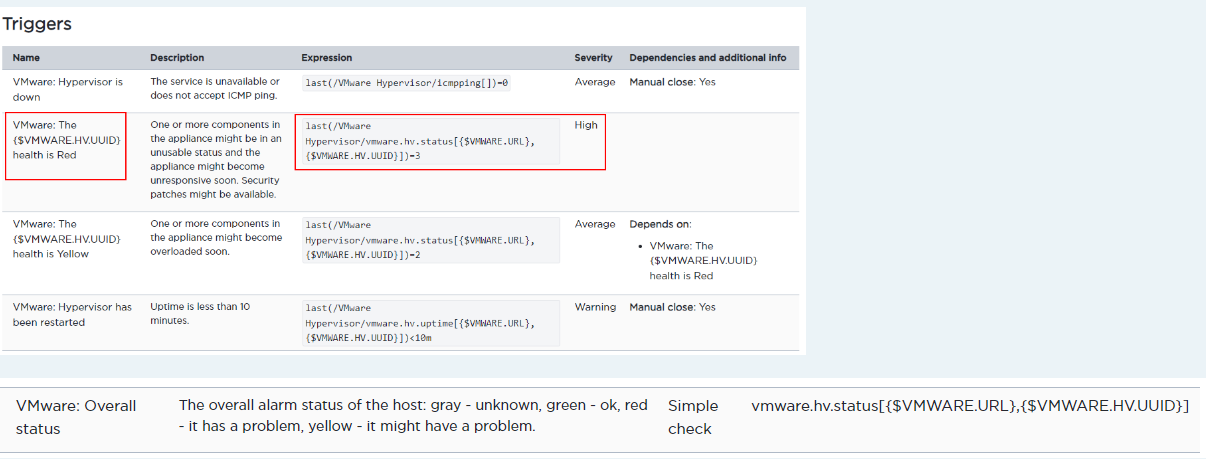
    I would like to better understand what VMware sends as status code to the VMware trigger: Overall status as I believe this is where the problem lies.

    This environment is new, recently built, as servers, switches and other equipment all new.

    I see at times CPU and memory consumption alerts for some virtual machines, but nothing out of the ordinary.


  • 2.  RE: Monitoring WMware with Zabbix

    Posted Aug 17, 2023 05:14 PM

    Have you checked if Zabbix has a dedicated guide or manual how to use it with Vmware? 

    https://www.zabbix.com/integrations/vmware


  • 3.  RE: Monitoring WMware with Zabbix

    Posted Aug 17, 2023 06:54 PM

    Yes, the information I inserted in the post I collected from the Zabbix documentation, but the description is insufficient to understand what VMware Overall status is and what VMware considers to send this information to Zabbix.


  • 4.  RE: Monitoring WMware with Zabbix

    Posted Aug 18, 2023 01:32 PM

    Once we were using Zabbix, there was integration with vROps (now Aria), so the environment was monitored via vROps, and alerts were sent to Zabbix. 

    Otherwise, you need to understand triggers to figure it out. 


  • 5.  RE: Monitoring WMware with Zabbix

    Posted Aug 18, 2023 01:44 PM

    The triggers are correct, I just need to understand what "vmware.hv.status" is because it is this information that is sent to Zabbix.

    Now, what does VMware consider to send this code to Zabbix? CPU, memory, disk?


  • 6.  RE: Monitoring WMware with Zabbix

    Posted Aug 21, 2023 10:16 AM

    The "vmware.hv.status" metric in VMware vCenter Server is used to monitor the overall health and status of virtual machines (VMs) and hosts within your virtualized environment. This metric is typically used for monitoring and alerting purposes, allowing you to keep an eye on the performance and availability of your virtual infrastructure.


  • 7.  RE: Monitoring WMware with Zabbix

    Posted Aug 21, 2023 11:10 AM

    Hi  ,

    Thanks for the feedback.

    Yes, there's no doubt about the functionality itself, the question is how VMware calculates this metric to tell if it's healthy or not? As I said before, the cluster is healthy, the hosts are not new, new storage, new cabling, there are no hardware alerts, there are no iLO alerts.

    I only see virtual machines consuming more resources at times, with CPU alerts and a message that there is a vCenter update for version 8 (I'm on 7), but for the rest I don't see any alerts that could justify this Overall bad status.

    It's very frustrating not knowing what's causing it...


  • 8.  RE: Monitoring WMware with Zabbix

    Posted Aug 21, 2023 12:27 PM

    Hey  


    It could be a number of factors like Resource Utilization, Configuration Consistency, hardware health, etc... My advice would be to disable this trigger and build the triggers you find useful. 


  • 9.  RE: Monitoring WMware with Zabbix

    Posted Aug 21, 2023 09:08 PM

    Yes... and this makes it very difficult to know what is causing the alert to be generated because it could be several things...

    Anyway, I have an open support case with VMware, but I'm going to evaluate whether I'll continue with this alert activated because I already have other more specific ones that give me more concrete data.