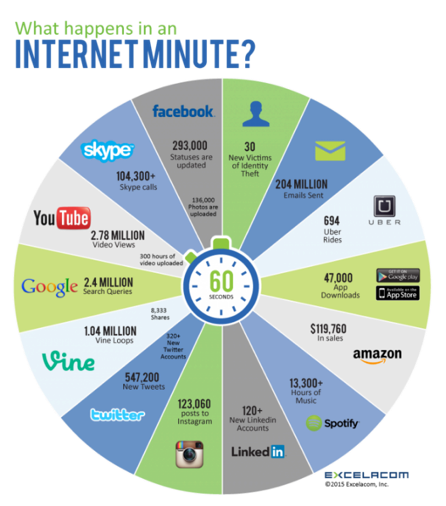
Recently a new infographic titled “What Happens in an Internet Minute?” caught my attention, not because of the facts, but rather the questions it provoked. What is happening within my applications in the data center?
Today, flash technology and high-performance storage networks have changed the way we think about applications and their performance. The diagram below can easily be substituted with enterprise’s mixed mission-critical and non-critical applications.

Similar to the growth of the Internet, organizations are facing unprecedented data growth, pressure to transform IT into an economic engine, and demands for actionable intelligence to deliver predictable performance and operational stability for their IT infrastructures. Reliable storage infrastructure within a data center is critically important to support these objectives. The question is, “How I can gain a deeper understanding of what is happening in my storage environment?”
When organizations experience issues that impact application performance, they are often left without knowing what the root cause is because of a lack of visibility into the end-to-end IT infrastructure. Many times, IT organizations rely on guesswork and experience to try to identify and resolve issues across their compute, network, and storage resources. This is like trying to fly a plane without any gauges.

With all of the outside pressures IT is facing, relying on guesswork and expertise is simply not good enough for organizations that require 100 percent availability. In fact, the lack of complete visibility into the IT infrastructure can cause excessive and unnecessary application performance impact and downtime events.
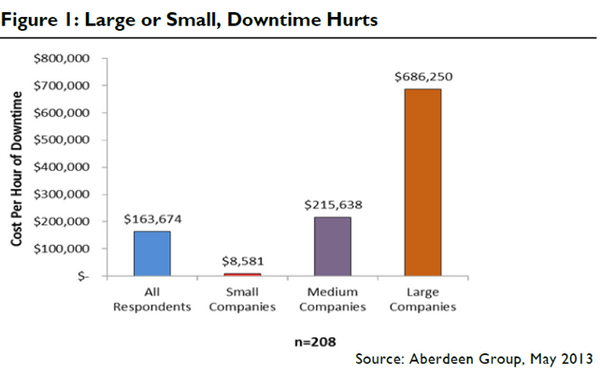
According to the "Aberdeen Group survey, Downtime and Data Loss: How Much Can You Afford?," the cost of downtime averages $163,674 an hour. In addition to the cost, the study found that the average time to 100 percent fully functional recovery took 5.18 hours.

To help organizations achieve predictable performance and operational stability, Brocade has announced a breakthrough in analytics for SAN optimization. The Brocade Analytics Monitoring Platform provides advanced storage telemetry, including storage device I/O performance, latency, and other SCSI metrics, across the network. The Analytics Monitoring Platform is a purpose-built SAN appliance dedicated to measuring application- and device-level I/O performance and analyzing traffic behavior within a Brocade Gen 5 Fibre Channel network.

Analytics deliver actionable intelligence to administrators, enabling them to proactively resolve problems in order to maximize performance across the data center. The Analytics Monitoring Platform utilizes Brocade Fabric Vision technology to non-invasively and non-disruptively provide insight into performance and analytics data collection, thereby dramatically reducing troubleshooting time.
The Analytics Monitoring Platform includes diagnostic and monitoring capabilities integrated into Brocade Gen 5 Fibre Channel technology to provide visibility into application, host, fabric, and storage performance.
Some key benefits include:
Unmatched Monitoring
- Application-level performance monitoring and alerting (MAPS) with zero downtime
- SCSI command behavior and response time of any device without the link quality/performance impacts caused by highly invasive physical TAPs
- Normal device behavior learning by measuring metrics such as latency, IOPS, and pending I/O to identify anomalies and help ensure predictable performance
- The ability to discover and deploy monitoring automatically to tens of thousands of initiator/target and initiator/target/LUN pairs in a fabric
Advanced Troubleshooting
- Customizable reports to correlate metrics and events, and to summarize trends for behavior analysis
- On-demand, non-disruptive diagnostics of server, storage, and fabric devices to help quickly pinpoint problems
- Integrated device-level and fabric behavior metrics to provide visibility into the entire environment and simplify correlation of performance problems
- Granular threshold settings and automated alerts of unusual device behavior to enable early problem detection
Increased ROI
- Reduced time to deploy advanced monitoring and analytics from days or weeks to minutes
- Automated monitoring, alerting, and troubleshooting tasks to save administrators critical time
- Scale-out analytics for large environments without additional OpEx to further maximize ROI
- Integration with existing Brocade Network Advisor, Fabric Vision technology, and Brocade Fabric OS CLI tools to reduce the learning curve and save OpEx
All of these breakthrough diagnostic and monitoring capabilities help enterprises optimize their environments without compromising security or placing additional strain on compute, storage, or network resources.
So if you’re considering (or already using) an arsenal of probes and TAPs to monitor your IT infrastructure, think again! Eliminate the lengthy device and application downtime required for installation, not to mention the ongoing intrusion. It’s time for a more effective way to add intelligence into your network and make your job much easier.
Learn more about the Brocade Analytics Monitoring Platform at www.brocade.com/amp.
#BrocadeFibreChannelNetworkingCommunity#missioncriticalapplications#applicationperformance#apps#AnalyticsMonitoringPlatform#analytics#storage