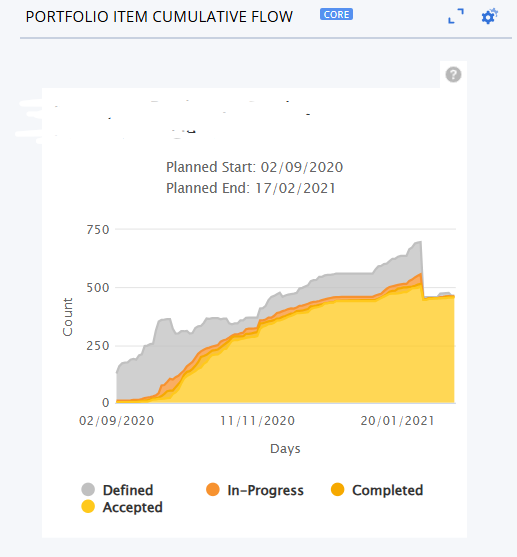
Basically the chart below filtered by a specific Business Outcome (Portfolio Item)
I found a way via the Custom App: Portfolio Item Cumulative Flow