Hi Everyone.
I need a recommendation from the community with this case.
We are in monitoring 300 servers with vmware probe but addicionality each server has robot installed with CDM and ntperf probe.
For cpu, each probe has:
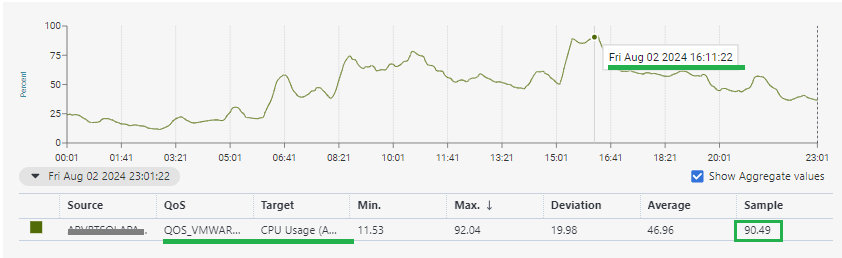
vmware: QOS_VMWARE_VM_CPU_AGGREGATE_USAGE - threshold: critical >= 90%
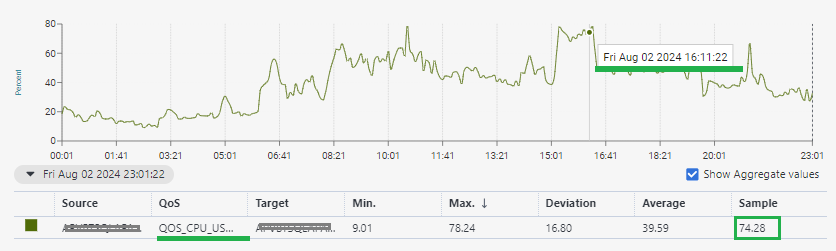
cpu: QOS_CPU_USAGE - threshold: critical >= 90%
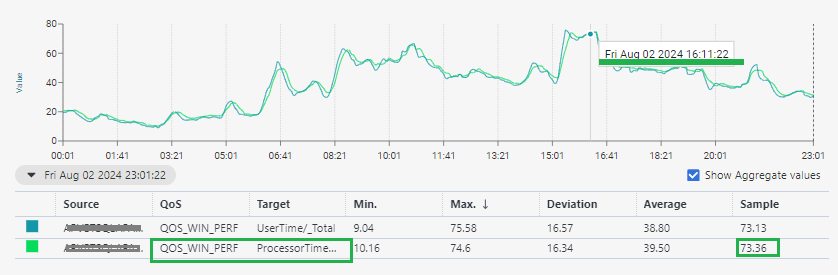
ntpfer: QOS_WIN_PERF - ProcessorTime/_Total - threshold: critical >= 90%
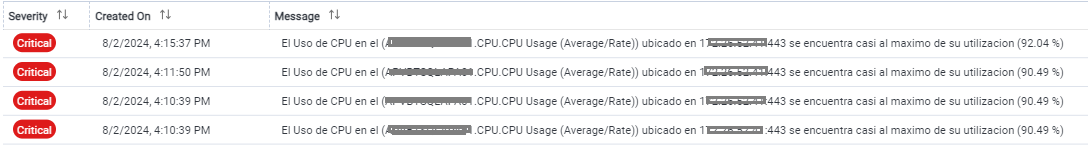
When the threshold is reached, vmware triggers the alarm, but it does not pass in the rest of the metrics (cdm, ntperf). I can understand that this does not happen because each metric has its polling interval and the data capture between one and the other may differ. I tried to standardize this, but I see that it continues to generate a vmware alert. This has been a problem between vmware and DB administrators, since each one ensures the health of components. So the question is, why is the alert generated in vmware and not in the operating system (cdm, ntperf)? This happens because vmware shows data above 90% and the cdm and ntperf probe does not.
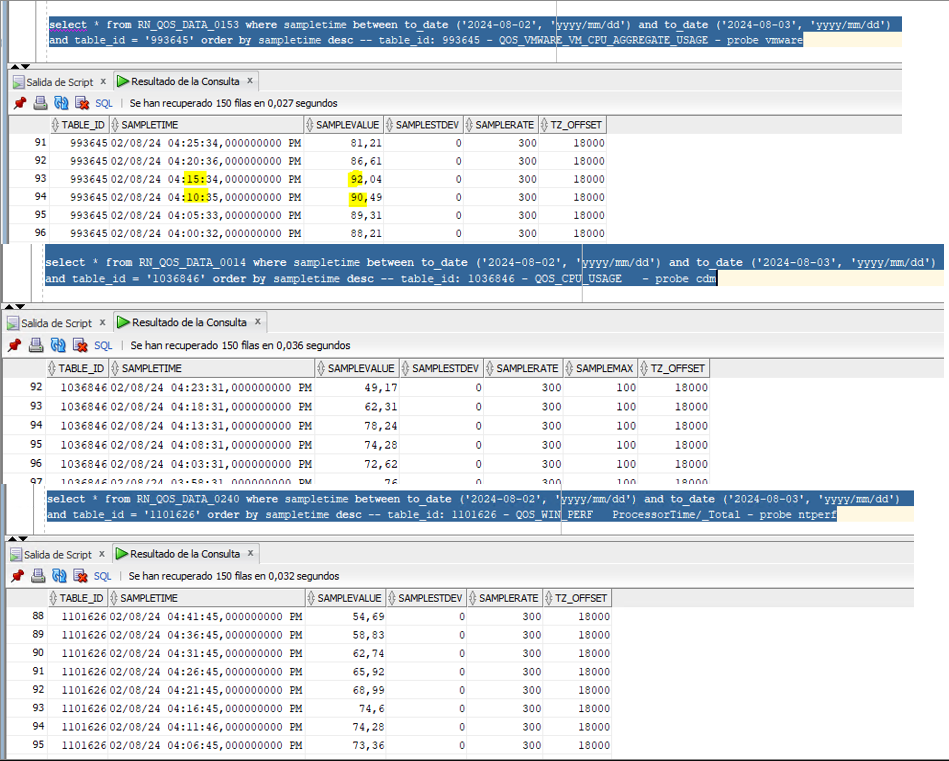
vmware:
cpu:
ntperf:
What can I do to standardize this and make the metrics match? I know that each metric has its monitoring strategy, but in theory these metrics should coincide at least a little, so you can see that when mvware is at 90%, cdm and ntperf are not, and this generates the false/positive session.
Has something similar happened to anyone?
Any suggestions?