Included probe: QueueCheck 2.9.9.1 can help you with:
- monitor all Hub and Nas queues in your environment
- calculate message rate between polls
- send alarms when thresholds' are breached
- send alarm when GET queue is not connected
- send alarm when ATTACH queue has no consumers
- clear alarm when needed
- send email when thresholds are breached
- more granular configuration settings compared with the old LUA script
- create qos metrics to create dashboard overviews, CABI/Jaspersoft report, Metric View or PRD report
- sample dashboards are included
Sample start dashboard:

Sample dashboard: Overview (with queue connect status, queueing last status, max/min last hour, qos rate last status and min/max last hour). This view should give you all important information in 1 screen.

Sample dashboard: hub status: (with last status, max last 6/12 hours, uptime, version)

Sample dashboard : Hub & Nas queues (with last status number metrics queued, max last 6/12 hours)

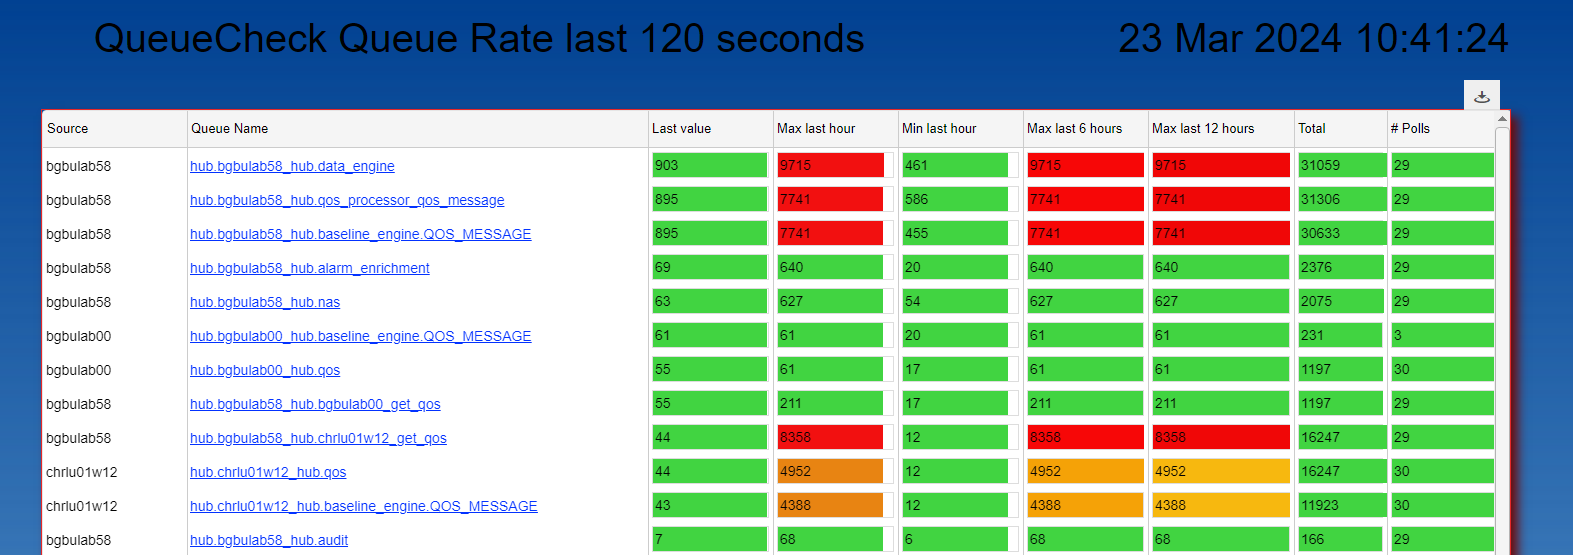
Sample dashboard: queue rate (number of metrics processed by each queue since previous poll)
Sample dashboard: queue bulk_size: (hub queue setting that can influence queue throughput)

Note1: This probe is written in Perl, but packaged with Perl source and compiled version
Note2: There is also a LUA queuecheck script available that reports/alarms only on the queued thresholds. This LUA script is still a valid solution if you want to have a **** solution with fewer customization possibilities and less qos metrics.
File: QueueCheck_2.9.9.zip is the probe to import into your archive
File: QueueCheck_utilities_2.9.9.zip contains the doc file and example files
New in 2.9.2:
- when a hub is started recently, the probe will wait 1 interval (for this hub) to avoid false alarms for probes that are starting
- new QoS: qos_queuecheck_diff, this metric will contain the number of alarms/qos processed by each queue in the previous probe interval. (activated by config: qos_on_diff)
- extra ci_type for the new qos metric in file: doc_ci_type_add.txt
- logging is reworked so that with loglevel=0 you can clearly check what the probe did
- new config parameters: hub_exclude and nas_exclude (in regex format)
- create (optional) alarm when an ATTACH queue has no consumers (activated by config: alarm_level_attach_no_consumer) at queue level
- create (optional) alarm when a GET queue is not connected (activated by config: alarm_level_get_not_connected) at queue level
- default config file can be used as an example, it will not send emails and all alarms are set to level: 1 (INFO) (only if nas/hub are inactive an alarm will be send)
- new version of mail script: nas_mail_queued.bat
New in 2.9.3:
- new parameters: get_queue_exclude and attach_queue_exclude to add exclude filters
- alarm_on_diff and alarm_level_diff_queue to define alarming on # processed_alarm/qos in last probe interval
- probe will now recognize a (remote) hub restart to calculate the difference in qos/alarm processed in the last probe interval
- add a second dashboard example based on qos_queuecheck_diff metrics
New in 2.9.4:
- add parameters: request_timeout and request_retry used in the UIM callbacks
- add parameter: log_subscriber_info to list of used subscribers for each hub
- parameters: get_queue_exclude, attach_queue_exclude and the queue section name parameter are now matched against the UIM address (name is now also regex)
- add parameter check_regex that can validate your regex parameters
New in 2.9.5:
- add queue section parameters: ignore_alarm_time_start and ignore_alarm_time_end. This gives you the possibility to suppress alarms during a time period, example during backup of the CA_UIM database
- add in log file the occurrence # of each problem
- add parameter display_clear_in_log; this will add a log entry for each clear that is executed
- when starting the probe a sql query will obtain the open alarms for probe queuecheck, from the nas_alarms table, and will acknowledge these. (instead of trying to execute a clear for every possible alarm)
- when monitoring the queue type TEMP for the number of queued qos/alarms, the alarm will contain the id and subject of the temp queue to help you finding the problematic queue.
- added 3 starting scenarios in the doc and utilities zip file.
New in 2.9.8:
- add qos: qos_queuecheck_rate (message rate between polls) activated by: qos_on_rate
- add qos: qos_queuecheck_count (total messages processed since start queue) activated by: qos_on_count
- add qos: qos_queuecheck_bulksize activated by: qos_on_bulksize
- add qos: qos_queuecheck_hubstatus: activated by: qos_on_hubstatus
- add qos: qos_queuecheck_hubuptime: activated by qos_on_hubuptime
- add sample dashboards with a _start_queuecheck dashboard
- add qos: qos_queuecheck_hubversion: activated by qos_on_hubversion
New in 2.9.9:
- add qos: qos_queuecheck_connect activated by: qos_on_attach_connect and qos_on_get_connect
- add new Overview dashboard with all important qos metrics on 1 page
- changed probe package to start with compiled (Windows) version & a example cfg file that is ready to be used. (you only need to configure, if not done previously, the file: nimsoft_generic.dat with the uim, sql access details)
New in 2.9.9.1:
- alarm suppression key was not always filled in correctly
- changed dashboard color green so that digits are more readable
- uim 23.4 changed the format of the hub version
- excluded nas queues from the "rate" dashboard because nas rate is not available
Problems, remarks, suggestions, ideas and enhancements are very welcome
#queuecheck #tool #probe #qos #monitor #threshold #alarm #mail #dashboard #hub #nas #queue #check