#ProductAnnouncements
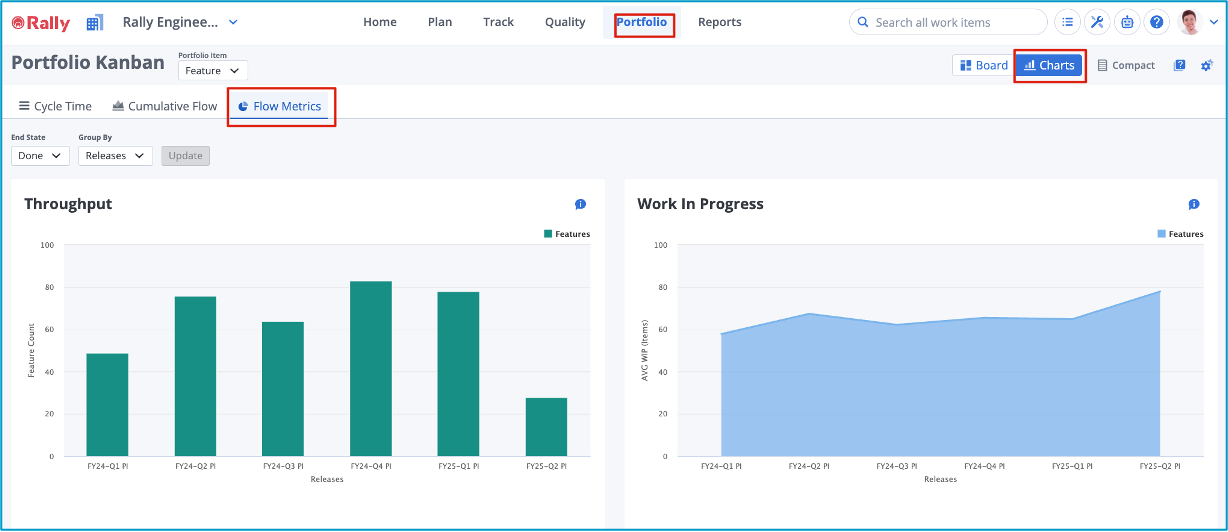
On May 21st, Portfolio Kanban Flow Metrics will be available via Feature Preview. We will be introducing two charts, Throughput and Work In Progress.
Portfolio Flow Metrics provide teams and leaders visibility into work flows across the portfolio, empowering better forecasting, governance, and process improvement.
What's New?
Throughput Chart - view progress of selected Portfolio Item type (by count) across a defined Portfolio Kanban state boundary over a time period. For example, the number of features, which reached "Done" state grouped by releases.
Work In Progress chart - shows the average number of portfolio items in progress during the selected timebox. For example, the average number of features in progress during each release. The WIP chart is based on derived states, leveraging the Actual Start Date and Actual End Date fields to determine when a portfolio item is in progress.
To enable this feature via Feature Preview, see our technical documentation on feature preview. We look forward to hearing your feedback once you have the chance to evaluate the new Portfolio Kanban Flow Metrics charts. Please reach out with questions or provide your feedback in Rally.
Thank you for your continued support.
Regards,
Wai-Yin Chee
Rally Product Management team