Symantec Access Management

Expand all | Collapse all

Siteminder Policy Trace Analysis

System

SystemFeb 27, 2012 02:44 PM

Ujwol

UjwolJun 26, 2014 08:45 PM

  • 1.  Siteminder Policy Trace Analysis

    Broadcom Employee
    Posted Feb 21, 2012 07:56 AM

    Software last updated 14-May-2019 - new version 681 uploaded.


    The original article has not been updated since its release, so I will add link to any recent (post Jan-2017) SMTraceAnalysisTool articles here  :


    Analyzing API Gateway trace logs for performance issues (another tool to use) 

    (Nov 2018)

    Tech Tip : SMPolicyTraceAnalysis - now result in 10% of the time.  

            (Aug 2017)

    SMPolicyTraceAnalysis - now able to graph ODBC transactions from odbctrace.out input 

           (June-2017) 

    Siteminder Spiral of Death (or why do I have all these socket 32 errors in my policy server logs) 

          (Sep-2014 - but useful) 

    Tech Tip - [PreciseTime] gives better Graphs & Stats with SMTraceAnalysisTool (Jan-2017)

    TechTip : two new graphs in SMPolicyTraceAnalysis tool explained.  (Jan-2017)


    Siteminder Policy Trace Analysis Tool

    Attached is a java Policy Log analysis tool that we have been using in CA Support for a while now for analysis of various SiteMinder logs.


    Currently it works on:

    • smps.log "stats" generated by regularly issuing a : "smpolicysrv -stats" command.
    • Policy Server trace logs (smtracedefault.log) files.
    • Webagent logs (including Normal Webagent WebAgentTrace.log files, and those from Secure Proxy Server, and FWS server)


    The program is the evolution of various prior perl and python scripts into a java program which then generates graphs and PDF reports of the results.


    The graphs in the PDF include :


    Distribution of ProcessRequest times (table plus graph) :


    Calculation of (real) concurrent thread activity :


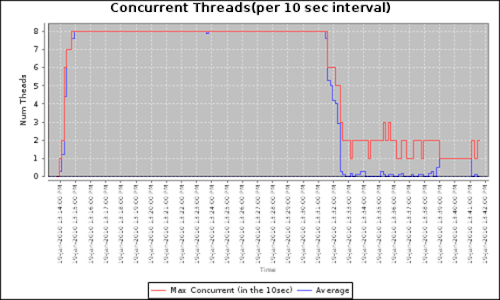
    And there are many more options included in the pdf report.


    Attached are both the java program SMPolicyTraceAnalysis_dist.zip, and the documentation SMPolicyTraceAnalysis_docs.zip showing sample graphs and explanation of how to use the program. And at some time in the near future we also hope to release the src to the java code as well,


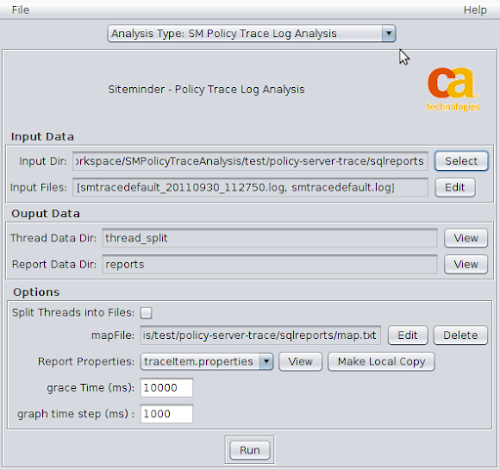
    In general for the SMPolicyTraceTool, at least for most basic uses, how to use the program is fairly self evident.


    This is an internally generated tool, done by CA Support engineers and subject to the limitations of the disclaimer applied to this discussion group for uploads.


    A tool like this, developed on a part time basis is never complete, certainly there are bugs, limitations, and also many features we would like to add. But the tool has proved useful internally with CA Support, as it currently is and hope you find it useful as well.


    Cheers - Mark

    Note: In respose to a request, here is a simple basic "howto" video, to show a basic install and run:
    http://www.youtube.com/watch?v=LEYhw5g-Yog

    I am adding a link to a "beta" or experimental version, it has some good and bad additions, and is not really complete. I am adding a beta, since it has already been delayed, and it will be a while until I get back to it again.
    10-Oct-2012 Added beta 298, it has some good speed and bug fixes over the beta 292 release. 20th-Oct-2012 Added beta 319, few fixes and some minor features, 31-Oct, added beta 335, bugs mainly (and removed earlier beta's, not allowed too many attachments). 6-Mar-2013 added beta 349, various fixes.
    28-Feb-2014 added updated version (still beta) 2.0.0-432 various fixes, also now reads R12.51+ logs.

    26-Oct-2015 added updated version (still beta) 2.0.0-472 various fixes, remembers last directory, cmd line mode (alpha-ish), full list in ChangeLog.txt

    .


    Message was edited by: Mark O'Donohue - added latest binary version (462).


    Message was edited by: Mark O'Donohue Added version 485 - variety of changes and fixes.


    Message was edited by: Mark O'Donohue Added version 489 - variety of changes and fixes.


    Message was edited by: Mark O'Donohue Added version 490 - When split trace into threads, also splits into different

                                                                                                         directories based on type of thread.

    Message was edited by: Mark O'Donohue Added version 491 - Fixed bug in parsing [Message] field when broken over 

                                                                                                         multiple lines and has some lines which end in ']' 

                                                                                                         To detect eol for multiline Message now checks for  

                                                                                                         current line end in ']' and next line start with '['  

    Message was edited by: Mark O'Donohue Added version 495 - Fixed issue with Stats Report, when smps.log use

                                                                                                         localtime, the first couple of entries are still GMT 

                                                                                                         was throwing off the "throughput" calculation at least.


                                                                                                         Fixed issue with state transitions in SrcFile and similar

                                                                                                         graphs where last state still in transaction but is not 

                                                                                                         completed by end of the trace, was giving -ve trans time.


    Message was edited by: Mark O'Donohue Added version 497 - Fixed issue with AvTransOverTime graph - optimization 

                                                                                                         had made it not collect any data for this metric.

    Message was edited by: Mark O'Donohue Added version 498 - Update to read new R12.52 Sp1 C5 Stats format from

                                                                                                         smps.log

    Message was edited by: Mark O'Donohue Added version 499 - Added larger readahead buffer, from 30,000 to 50,000

                                                                                                         characters, needed to cope with some SAML requests

                                                                                                         when field value reported in base64 and as hex values. 

                                                                                                         then one line is that long - maybe this should be variable

                                                                                                         that can be set dynamically, normal lines are usually 

                                                                                                         less than 1000 chars.

                                                                                                         Also fixed ca directory query log error, when find long

                                                                                                         transactions, print fmt is same as read format.

    Message was edited by: Mark O'Donohue Added version 500 - ca directory query log was not reporting individual 

                                                                                                         graphs for search/modify/etc current open requests 

                                                                                                         fixed - was way it inherited values from template graph.


    Message was edited by: Mark O'Donohue Added version 501 - fix EnqueueAndProcessMessage to display SrcLine

                                                                                                         graph and table - param had wrong name.

                                                                                                         Make EnqueueAndProcessMessage the first section.


                                                                                                         Enqueue And Process graphs the transaction from the

                                                                                                         time it is received on the policy server until the time it

                                                                                                         is finished processing - so it is a better measure of

                                                                                                         of av time the policy server took to process the. 

                                                                                                         message.  The queue wait and actual process time

                                                                                                         are still there, just this one is now the first section.  

    Message was edited by: Mark O'Donohue Added version 505 - Add ability to process odbctrace.out files

                                                                                                         Add ability to draw graphs for Agent_Con_Manager for 

                                                                                                         selected count, and the reported throughput and

                                                                                                         capacity

    Message was edited by: Mark O'Donohue Added version 506 - Add ability to auto recognise odbctrace(.*).out files

                                                                                                         Fix NullPointer bug when SrcFile was not in input file.

    Message was edited by: Mark O'Donohue Added version 588 - Speed improvement about 50% faster now.  Various  

                                                                                                         tests run to see what was effective, embedded db 

                                                                                                         still too slow, pool of threads didnt work, did add reader

                                                                                                         and process or thread - but more threading did not help                                                                                                        fixed (bad) was was doing time checks,  and reduced

                                                                                                         number of counters.  

    Message was edited by: Mark O'Donohue Added version 621 - Speed improvement again - now uses 64bit and keeps 

                                                                                                         most data in memory - but 3hr analysis can now take

                                                                                                         20min - so good performance gain.

    Message was edited by: Mark O'Donohue Added version 670 - Speed improvement added and testing done on each

                                                                                                         of the other 12 trace analysis report types : 

                                                                                                         PolicyTraceAnalysis,

                                                                                                         PolicyStatsAnalysis, AgentTraceAnalysis,

                                                                                                        SPSAgentTraceAnalysis, 

                                                                                                        IMServerLogAnalysis,

                                                                                                        AsaWebSphereAgentTraceAnalysis,

                                                                                                        AsaWebLogicAgentTraceAnalysis,
                                                                                                        CADirQueryLogAnalysis,

                                                                                                        ODBCTraceAnalysis, OracleLdapAccessAnalysis 

                                                                                                        (missed these three will have to revisit it in a day or so: 

                                                                                                        SDKAgentTraceAnalysis,WWSIAgentTraceAnalysis,

                                                                                                       FWSAgentTraceAnalysis)

    Message was edited by: Mark O'Donohue Added version 674 - Tested, WWSI, FWS, dont have trace set for SDK 

                                                                                                         Fixed bug where defaulted to Disk, not Memory.

                                                                                                         Fixed bug with EnqueueAndProcessRequest where 

                                                                                                         if dequeue occurred before enqueue in logs then was

                                                                                                         not counted.  Fixed where counters not reset 

                                                                                                         correctly when run in memory and NullPointerException

                                                                                                         when write to disk.

    Message was edited by: Mark O'Donohue Added version 676 - Fixed bug with restart of trace logs - with multithread 

                                                                                                         Fixed detection of smservercommand4 thread 

                                                                                                         there are some different pattern matches. 

    Message was edited by: Mark O'Donohue Added version 677 - Read of smps.log files from R12.7 fixed  

    Message was edited by: Mark O'Donohue Added version 678 - Added support for processing transactions from layer7

                                                                                                         ssg_0_0.log files.

    Message was edited by: Mark O'Donohue Added version 679 - minor changes to layer7 ssg log handling.

                                                                                                         handle service and trace start /end better for

                                                                                                         SrcFile trace analysis.  Also stop duplicate "long"

                                                                                                         transactions (they were reported from both

                                                                                                         ProcessRequest and ServiceRequest). 

    Message was edited by: Mark O'Donohue Added version 681 - minor changes to layer7 ssg log handling.

                                      Allow  LogCategory=com.l7tech.server.policy.assertion.ServerAuditDetailAssertion

                                      In addition to :  LogCategory=com.l7tech.log.custom.trace

                                      as this will be a common mistake people will make in entering the policy.


  • 2.  RE: Siteminder Policy Trace Analysis

    Broadcom Employee
    Posted Feb 25, 2012 09:44 PM
    From a POST in Linkedin, but figured I would add the reply here as well.


    Generally the tool is pretty simple to run, select a directory with smtracedefault.log files, select the input log files, and then hit run.

    For best results add [PreciseTime][SrcFile][Function]

    Although selecting the log files can be a bit tricky, with different name sorting conventions, and if you have gaps in the traces.

    Its the weekend here, and maybe I'll add a short video on Monday.

    Steve also added a short cut reference link:

    http://tiny.cc/SMTraceAnalysisTool

    Cheers - Mark


  • 3.  RE: Siteminder Policy Trace Analysis

     
    Posted Feb 27, 2012 02:44 PM
    Thanks for all the information Mark!


  • 4.  RE: Siteminder Policy Trace Analysis

    Broadcom Employee
    Posted Feb 27, 2012 06:43 PM
    Hi

    In respose to a request, here is a simple basic "howto" video, to show quick SMPolicyTraceTool in normal operation:

    http://www.youtube.com/watch?v=LEYhw5g-Yog

    Cheers - Mark


  • 5.  RE: Siteminder Policy Trace Analysis

    Posted Apr 19, 2012 03:21 PM
    Mark,

    Could you provide an 'ideal' smtracedefaul.txt file to be used to get a base line of our production environment?

    Thanks,

    Jeff


  • 6.  RE: Siteminder Policy Trace Analysis

    Broadcom Employee
    Posted May 01, 2012 12:34 AM
      |   view attached
    Hi Jeff

    jeffrey.marcinko wrote:


    Could you provide an 'ideal' smtracedefaul.txt file to be used to get a base line of our production environment?
    I've attached a starting trace profile that we often use, to track the basic transactions - that probably should cover most bases for a first pass through tracing performance.

    Cheers - Mark

    Attachment(s)

    txt
    smtrace.template.txt   814 B 1 version


  • 7.  RE: Siteminder Policy Trace Analysis

    Posted May 01, 2012 09:18 AM
    Mark,

    Thanks for the template. The analysis tool has helped set a baseline for our environment.

    -Jeff


  • 8.  RE: Siteminder Policy Trace Analysis

    Posted Jun 15, 2012 09:51 AM

    jeffrey.marcinko wrote:

    Mark,

    Thanks for the template. The analysis tool has helped set a baseline for our environment.

    -Jeff
    Hi Jeff,

    Any other suggestions on this tool? You mentioned you created a baseline which is an excellent idea. Without the baseline, how does one know if they are having problems or not?

    Is your baseline from just the stats output, or are you also running profiler logs?

    -Steve


  • 9.  RE: Siteminder Policy Trace Analysis

    Posted Jun 15, 2012 10:22 AM
    Steve,

    I've done a number of things to establish a "baseline" for capacity and throughput of our production policy servers. I ran the trace analysis tool everyday for 2 weeks at 9:00am and 11:00am (our busiest times). I used the stats and profiler logs but I focused on the profiler data. The output of the trace analysis gave us a reasonable expectation for the number of authentications, authorizations, and ldap operations each policy server is doing when busy. We were also able to get an idea of throughput for each operation which doesn't seem to change by more than a millisecond or two on average.

    In addition to running the trace tool I've taken a week of authentication data for each month for the last six months from our audit db. I separate this data by 24 hour period and graph it so we can see growth in the service from a hourly/daily/weekly authentication perspective. I also used the audit db data to look at our peak period during the last six months. This information and our 'normal' usage graphs gives us another way to estimate load using the equation in the implementation guide. (authentication_load * percentage_of_authentication_requests) / number_of_sustained_hours / 3600 = sustained_authentication_rate)

    The only problem I've had with the tool is finding a place to run it. Our profiler logs are huge in prod, >1gb per 15 minutes. This makes it hard to find disk space and it takes the tool a considerable amount of time to process, though I'm not sure that can be helped. I'm running it on a Sun v890, 2 cpu, 16gb memory server. The other comment I have is that the output could use a little more description/explanation of some of the graphs generated. For example I'm not sure how to interpret 'num threads in state' and whether or not our output is "normal" or indicates a bottleneck.

    Thanks,
    Jeff


  • 10.  RE: Siteminder Policy Trace Analysis

    Posted Jun 15, 2012 12:22 PM
    Thanks Jeff. I'll chat with Mark to see about making the output a little more friendly.

    Have anyone else used this tool? If so, what are your comments? I feel this is one of those hidden secrets that really should be shared with more people.


  • 11.  RE: Siteminder Policy Trace Analysis

    Posted Jun 15, 2012 12:39 PM
    From the graph it is pretty difficult to find race conditions, also when i run the tool for a bigger smtrace log file, the tool crashes with the below error.. Any idea ?


    java.io.FileNotFoundException
    : C:\smtrace\thread_split\tmp\lasttrans_4628795712135119537.log (Access is denied)


    java.lang.RuntimeException: java.io.FileNotFoundException: C:\smtrace\thread_split\tmp\lasttrans_4628795712135119537.log (Access is denied)

    at com.ca.siteminder.policytraceanalysis.cmd.TransTraceStore_Disk.writeTransLog(SmTransactionInfo.java:476)

    at com.ca.siteminder.policytraceanalysis.cmd.TransTraceStore_Abstract.writeTransLog(SmTransactionInfo.java:359)

    at com.ca.siteminder.policytraceanalysis.cmd.SmTransactionInfo.writeTransLog(SmTransactionInfo.java:298)

    at com.ca.siteminder.policytraceanalysis.cmd.SmTransactionInfo.addLine(SmTransactionInfo.java:83)

    at com.ca.siteminder.policytraceanalysis.cmd.SmTransactionInfo.startTrans(SmTransactionInfo.java:106)

    at com.ca.siteminder.policytraceanalysis.cmd.TimeTraceItem$TraceThreadStateInfo.addNormalLine(TimeTraceItem.java:537)

    at com.ca.siteminder.policytraceanalysis.cmd.TimeTraceItem$TraceThreadStateInfo.addLine(TimeTraceItem.java:386)

    at com.ca.siteminder.policytraceanalysis.cmd.TimeTraceItem.addLine(TimeTraceItem.java:246)

    at com.ca.siteminder.policytraceanalysis.cmd.SmPolicyTraceMain.processTraceLine(SmPolicyTraceMain.java:346)

    at com.ca.siteminder.policytraceanalysis.cmd.SmPolicyTraceMain.processTraceFile(SmPolicyTraceMain.java:298)

    at com.ca.siteminder.policytraceanalysis.cmd.SmPolicyTraceMain.processTraceFiles(SmPolicyTraceMain.java:213)

    at com.ca.siteminder.policytraceanalysis.gui.TraceLogAnalysisMainPanel_Abstract.processTraceFiles(TraceLogAnalysisMainPanel_Abstract.java:669)

    at com.ca.siteminder.policytraceanalysis.gui.TraceLogAnalysisMainPanel_Abstract$SplitTraceFilesMonitor.doInBackground(TraceLogAnalysisMainPanel_Abstract.java:687)

    at com.ca.siteminder.util.TaskProgressMonitor_GuiImpl.doInBackground(TaskProgressMonitor_GuiImpl.java:1)

    at javax.swing.SwingWorker$1.call(Unknown Source)

    at java.util.concurrent.FutureTask$Sync.innerRun(Unknown Source)

    at java.util.concurrent.FutureTask.run(Unknown Source)

    at javax.swing.SwingWorker.run(Unknown Source)

    at java.util.concurrent.ThreadPoolExecutor$Worker.runTask(Unknown Source)

    at java.util.concurrent.ThreadPoolExecutor$Worker.run(Unknown Source)

    at java.lang.Thread.run(Unknown Source)
    Caused by: java.io.FileNotFoundException: C:\smtrace\thread_split\tmp\lasttrans_4628795712135119537.log (Access is denied)

    at java.io.FileOutputStream.open(Native Method)

    at java.io.FileOutputStream.<init>(Unknown Source)

    at java.io.FileOutputStream.<init>(Unknown Source)

    at java.io.FileWriter.<init>(Unknown Source)

    at com.ca.siteminder.policytraceanalysis.cmd.TransTraceStore_Disk.writeTransLog(SmTransactionInfo.java:469)

    ... 20 more


  • 12.  RE: Siteminder Policy Trace Analysis

    Broadcom Employee
    Posted Jun 18, 2012 03:54 AM
    Hi

    subhodeepghosh wrote:


    From the graph it is pretty difficult to find race conditions,
    There are some limits to what can be determined from what is in the trace log. Is there anything specifically that you are looking to find ?

    The "Lock Detect" feature, does graph counts where numbers of threads are all found in the same state at the same time, which gives some visibility to where, say a semaphore is keeping a number of threads on hold, or where there is a resource limit - is that the type of feature you are looking for?

    subhodeepghosh wrote:


    Also when i run the tool for a bigger smtrace log file, the tool crashes with the below error.. Any idea ?

    java.io.FileNotFoundException
    : C:\smtrace\thread_split\tmp\lasttrans_4628795712135119537.log (Access is denied)


    java.lang.RuntimeException: java.io.FileNotFoundException: C:\smtrace\thread_split\tmp\lasttrans_4628795712135119537.log (Access is denied)

    at com.ca.siteminder.policytraceanalysis.cmd.TransTraceStore_Disk.writeTransLog(SmTransactionInfo.java:476)

    at com.ca.siteminder.policytraceanalysis.cmd.TransTraceStore_Abstract.writeTransLog(SmTransactionInfo.java:359)
    Yes, this is a bug (in my code), it comes from trying to minimize the number of open files, and for each worker thread it re-used the same file to keep the last transaction. Unfortuantly the "cleanup" before a new run has deleted all the files in the tmp directoy and the "tmp" directory as well. I think this only occurs on re-run, or re-run where you have re-selected the same directory - but an exit and restart of the program will fix it.

    There is also a unix related bug, where for long transactions it stores the timestep counters on disk (minimize memory usage) where it opens more than 1024 file handles, for Linux (unbuntu) at least that exceeds the defaulit file open handle, and you get an exception thrown there too.

    Cheers - Mark


  • 13.  RE: Siteminder Policy Trace Analysis

    Posted Jun 21, 2012 09:02 AM
    Hello,

    When I want to do a trace analysis I have this error :

    Unable to get timestamp from record, unable to parse one of [date] [timestamp] or [time] - missmatched field mapping ?

    Have you an idea ?

    Best regards.

    Ludovic.


  • 14.  RE: Siteminder Policy Trace Analysis

    Posted Jun 21, 2012 10:14 AM
    Hi Ludovic,

    Can you please post the first line of the file that you are loading? (The one that lists all the fields within brackets.)


  • 15.  RE: Siteminder Policy Trace Analysis

    Posted Jun 21, 2012 11:15 AM
    Hi Steven,

    I found the solution by correcting the file smtracedefault.txt .

    Thank you for your help.
    This tool is great.

    Best regards,

    Ludovic.


  • 16.  RE: Siteminder Policy Trace Analysis

    Broadcom Employee
    Posted Jun 21, 2012 09:20 PM
    Hi

    Ludovic wrote:


    I found the solution by correcting the file smtracedefault.txt .
    Just to follow up, to workout which fields are in the trace log file the tool will:

    a) First it will look for the header lines which has the field names in the format :

    [Date][PreciseTime][Message][....
    [====][=========][========][....

    That sort of thing.

    b) But if there is no header,then it will try and generate one.
    The original design was if no header was found, then you could manually create a map.txt file with the details. However often, in support, we are on the phone to a customer, and trying to generate a report at the same time. Being male, my multi taking ability is limited, and so I eventually added some code to generate a header.

    To generate a map.txt file, it reads the first 1000 or so lines in the trace log and looks for patterns in the fields to identify them, and also some special rules, like for things like PID vs TID it checks to see which ones change, that sort of thing.

    As it turns out it does a fairly good job, and mostly gets all of the needed fields even when you dont have the header lines.

    And :

    Ludovic wrote:


    Thank you for your help.
    This tool is great.
    Thanks, very glad to see it be of use.

    Cheers - Mark


  • 17.  RE: Siteminder Policy Trace Analysis

    Posted Jun 22, 2012 06:16 AM
    Hello Mark,

    Thank you for your help.
    I can generate the reports that I want.

    Is it possible to generate these stats via command line?

    Best regards,

    Ludovic.


  • 18.  RE: Siteminder Policy Trace Analysis

    Broadcom Employee
    Posted Jun 26, 2012 07:12 PM
    Hi Ludovic

    Ludovic wrote:


    Is it possible to generate these stats via command line?
    Not yet - the gui is a layer on top of the scanning/generating code, that has been done deliberately to allow it to be cmd line driven at some time.

    Cheers - Mark


  • 19.  RE: Siteminder Policy Trace Analysis

    Posted Jul 03, 2012 08:11 AM
    Thank you Mark for your answer.
    Have you an idea how we could automate it?

    Best regards.

    Ludovic.


  • 20.  RE: Siteminder Policy Trace Analysis

    Broadcom Employee
    Posted Jul 06, 2012 04:10 AM
    Not at this stage,

    Eventually the plan is that it will run in a batch cmd line mode, taking the setting from a combination of some settings from a (new) property file and reading some settings from the command line.

    But there is no definitive date for it.

    Cheers - Mark


  • 21.  RE: Siteminder Policy Trace Analysis

    Posted Jul 11, 2012 06:36 AM
    Thanks Mark.

    Best regards.

    Ludovic.


  • 22.  RE: Siteminder Policy Trace Analysis

    Posted Dec 10, 2012 08:06 AM
    Mark,

    Where can I find the most up to date version of the trace analysis tool?

    Thanks,

    Jeff


  • 23.  RE: Siteminder Policy Trace Analysis

    Broadcom Employee
    Posted Dec 11, 2012 04:28 AM
    Hi Jeffery

    jeffrey.marcinko wrote:

    Where can I find the most up to date version of the trace analysis tool?
    The latest one is the beta one linked to in the initial message above (I updated it a few times), it is pretty stable, and back to reasonable performance at reading trace files again.

    Cheers - Mark

    PS: And in answer to a previosu question, it is compiled with target of java 1.6


  • 24.  RE: Siteminder Policy Trace Analysis

    Posted Feb 13, 2014 11:41 AM
    mark.odonohue:
    Not at this stage, Eventually the plan is that it will run in a batch cmd line mode, taking the setting from a combination of some settings from a (new) property file and reading some settings from the command line. But there is no definitive date for it. Cheers - Mark


    Hi Mark, 

    wonderful tool to get insights on what happend using the logs. 

    we are wondering if we can use the command line tool or have an automated way of running this tool from a bash/shell script and have the results sent everyday to our inboxes via email.

    how far is your work on the batch cmd line mode looking?? can we expect the same some time soon.?

    Our requirement: (can you suggest how to go about and use the tool for the following)

    in Unix is there a way to run the reports every day at  a scheduled time(sometime in offhours) to generate the reports and have the reports emailed to us?


  • 25.  RE: Siteminder Policy Trace Analysis

    Broadcom Employee
    Posted Jul 15, 2012 04:29 AM
    Hi Subhodeepghosh

    You wrote:

    subhodeepghosh wrote:


    Also when i run the tool for a bigger smtrace log file, the tool crashes with the below error.. Any idea ?

    java.io.FileNotFoundException
    : C:\smtrace\thread_split\tmp\lasttrans_4628795712135119537.log (Access is denied)

    java.lang.RuntimeException: java.io.FileNotFoundException: C:\smtrace\thread_split\tmp\lasttrans_4628795712135119537.log (Access is denied)

    at com.ca.siteminder.policytraceanalysis.cmd.TransTraceStore_Disk.writeTransLog(SmTransactionInfo.java:476)

    at com.ca.siteminder.policytraceanalysis.cmd.TransTraceStore_Abstract.writeTransLog(SmTransactionInfo.java:359)
    I have found another condition where you will get a FileNotFoundException for these tmp/lastrans_***.log files.

    It is not the case above, but if you run on a moderately deep nested directory level then either java or Windows OS seems to have some limit for file name length. That should not be the case for NT systems - but the problem did happen on a Win7 machine. (and 256 characters may be the limit from a few google searches, but looks like it was reported and fixed as a bug, so not sure why we are getting it in win7/java 1.6).

    However, moving to a directory, nearer the root of the drive fixed the issue, at least for this particular case - so if you have this problem that may be worth trying.

    Cheers - Mark

    PS: The "4628795712135119537" part of the lasttrans_4628795712135119537.log above, is generated using File.createTempFile().


  • 26.  RE: Siteminder Policy Trace Analysis

    Posted Jan 02, 2013 03:35 PM
    Hi everyone

    This looks like a great tool. But I am unable to get this to work I am also having this error

    java.lang.RuntimeException: java.io.FileNotFoundException: C:\DATA\thread_split\tmp\lasttrans_2028036912888409376.log (Access is denied)

    at com.ca.siteminder.policytraceanalysis.cmd.TransTraceStore_Disk.writeTransLog(SmTransactionInfo.java:476)

    at com.ca.siteminder.policytraceanalysis.cmd.TransTraceStore_Abstract.writeTransLog(SmTransactionInfo.java:359)

    at com.ca.siteminder.policytraceanalysis.cmd.SmTransactionInfo.writeTransLog(SmTransactionInfo.java:298)

    at com.ca.siteminder.policytraceanalysis.cmd.SmTransactionInfo.addLine(SmTransactionInfo.java:83)

    at com.ca.siteminder.policytraceanalysis.cmd.SmTransactionInfo.startTrans(SmTransactionInfo.java:106)

    at com.ca.siteminder.policytraceanalysis.cmd.TimeTraceItem$TraceThreadStateInfo.addNormalLine(TimeTraceItem.java:537)

    at com.ca.siteminder.policytraceanalysis.cmd.TimeTraceItem$TraceThreadStateInfo.addLine(TimeTraceItem.java:386)

    at com.ca.siteminder.policytraceanalysis.cmd.TimeTraceItem.addLine(TimeTraceItem.java:246)

    at com.ca.siteminder.policytraceanalysis.cmd.SmPolicyTraceMain.processTraceLine(SmPolicyTraceMain.java:346)

    at com.ca.siteminder.policytraceanalysis.cmd.SmPolicyTraceMain.processTraceFile(SmPolicyTraceMain.java:298)

    at com.ca.siteminder.policytraceanalysis.cmd.SmPolicyTraceMain.processTraceFiles(SmPolicyTraceMain.java:213)

    at com.ca.siteminder.policytraceanalysis.gui.TraceLogAnalysisMainPanel_Abstract.processTraceFiles(TraceLogAnalysisMainPanel_Abstract.java:669)

    at com.ca.siteminder.policytraceanalysis.gui.TraceLogAnalysisMainPanel_Abstract$SplitTraceFilesMonitor.doInBackground(TraceLogAnalysisMainPanel_Abstract.java:687)

    at com.ca.siteminder.util.TaskProgressMonitor_GuiImpl.doInBackground(TaskProgressMonitor_GuiImpl.java:1)

    at javax.swing.SwingWorker$1.call(Unknown Source)

    at java.util.concurrent.FutureTask$Sync.innerRun(Unknown Source)

    at java.util.concurrent.FutureTask.run(Unknown Source)

    at javax.swing.SwingWorker.run(Unknown Source)

    at java.util.concurrent.ThreadPoolExecutor.runWorker(Unknown Source)

    at java.util.concurrent.ThreadPoolExecutor$Worker.run(Unknown Source)

    at java.lang.Thread.run(Unknown Source)
    Caused by: java.io.FileNotFoundException: C:\DATA\thread_split\tmp\lasttrans_2028036912888409376.log (Access is denied)

    at java.io.FileOutputStream.open(Native Method)

    at java.io.FileOutputStream.<init>(Unknown Source)

    at java.io.FileOutputStream.<init>(Unknown Source)

    at java.io.FileWriter.<init>(Unknown Source)

    at com.ca.siteminder.policytraceanalysis.cmd.TransTraceStore_Disk.writeTransLog(SmTransactionInfo.java:469)

    I have tried the suggestions of using a new directory and a stop/restart of the program. But I am still unable to get through one tracefile. I am on a Windows 7 machine with Java 1.7 any help would be greatly appreciated


  • 27.  RE: Siteminder Policy Trace Analysis

    Broadcom Employee
    Posted Jun 18, 2012 01:05 AM
    Hi Jeffrey

    jeffrey.marcinko wrote:


    I've done a number of things to establish a "baseline" for capacity and throughput of our production policy servers. I ran the trace analysis tool everyday for 2 weeks at 9:00am and 11:00am (our busiest times). I used the stats and profiler logs but I focused on the profiler data.

    The output of the trace analysis gave us a reasonable expectation for the number of authentications, authorizations, and ldap operations each policy server is doing when busy. We were also able to get an idea of throughput for each
    operation which doesn't seem to change by more than a millisecond or two on average.
    That is good to hear, and I am glad its been useful. We have tended to rely on the regular "stats" graph in the smps.log files for load comparison and to look for "spikes" in queue depth. Generally for us it has been easier to get customers to run the stats regularly since the additional output is not large and the impact is fairly minimal. In CA Support the trace analysis it more often used from a diagnostic point to view, to try and shed some light on a root cause. But having said that, in doing so we still often try to get a trace for a "normal" time to compare to the trace from a "problem" time. And I know part of Steve's motivation for getting the SMPolicyTraceTool out into the CA community site was to encourage other uses, such as what you are doing with the tool.

    jeffrey.marcinko wrote:


    The only problem I've had with the tool is finding a place to run it. Our profiler logs are huge in prod, >1gb per 15 minutes. This makes it hard to find disk space and it takes the tool a considerable amount of time to process, though I'm not sure that can be helped. I'm running it on a Sun v890, 2 cpu, 16gb memory server.
    For disk space to store the trace files, I do hope to be able to change it so the tool can directly read compressed input trace files at some stage, its on a long list of todo items :-)

    For the memory and time taken to process however, I think I can help with that. The SMPolicyTraceTool, keeps points for each graph timestep, so memory usage tends to be related to how many points are on the graph, not on the size of the input smtracedefault.log files. Java also tends to go slower as memory get tighter parsing takes longer as java fights harder and harder to find some free memory, the default script adds -mx256m to limit memory usage to 256meg.

    Now the default graph timestep is 1sec (1000ms) , if you have traces over a day for example, then it is 1x60x60x24x(all graph counter) points. So for larger trace times its best to change the "graph time step (ms)" value from the default of 1sec (1000ms) to something larger say, 1min, or 10min (60000ms, or 600000ms respectively). Recently we had a week of trace data, and it ran out of memory on 1sec, but worked fine with a graph step of 10min.

    In an ideal world, the program would suggest a good timestep based on the start end times of the trace files (and in an ideal world, it would also sort the input trace files as well, so you dont get into trouble if you mix up the input file order). But for now the graph step time can be manually set, as the "graph time step (ms)" just above the "Run" button.

    jeffrey.marcinko wrote:


    The other comment I have is that the output could use a little more description/explanation of some of the graphs generated. For example I'm not sure how to interpret 'num threads in state' and whether or not our output is "normal" or indicates a bottleneck.
    Yes, some of those are a little vague, and could do with better explanation. Some of the graphs are also a little experimental as well, and need to evolve (or perhaps be optional). I hope to add a bit more detail to the documentation in the next version.

    But generally for the "State" graphs and tables if you find there are some "states" where all the threads are spending time, or where many threads are in the same state at the same time, then that can be an indication of either a resource limit or bottleneck. As mentioned earlier, we have used these more in a diagnostic step, we dont have any specific data on what would be expected from a normal running system, but I can see that it could be useful to attempt to calibrate what would be expect from a normal running system.

    Cheers - Mark


  • 28.  RE: Siteminder Policy Trace Analysis

    Posted Jun 21, 2012 08:36 AM
    Hello,

    I am a new French user.
    I just download your tool.
    Thank you very much for your work, I will try to use it.

    Sincerely,

    Ludovic.


  • 29.  RE: Siteminder Policy Trace Analysis

    Posted Jun 22, 2012 06:44 AM
    Looks like the script cannot be invoked/run remotely and we have to be local admin on the server to run it. Is it possible to run the script using a CA-7 job or some other scheduler?
    Our policies do not allow to run anything locally as admin on policy server.


  • 30.  RE: Siteminder Policy Trace Analysis

    Posted Jun 26, 2012 01:57 PM
    Any response will be appreciated. Thanks!


  • 31.  RE: Siteminder Policy Trace Analysis

    Broadcom Employee
    Posted Jun 26, 2012 07:01 PM
    Hi cadude -

    Yes it is possibly to run the "smpolicysrv -stats" via windows scheduler, somewhere in the doco it mentions how to set that up, with cron or windows scheduler.

    Windows 2008 is also a bit "special" - I have a document for that too - and will post that latter today (perhaps a note in the general section).

    Cheers - Mark


  • 32.  RE: Siteminder Policy Trace Analysis

    Posted Jul 03, 2012 08:43 AM
    Thanks Mark,

    Will wait for the Windows 2008 document. Appreciate it.


  • 33.  RE: Siteminder Policy Trace Analysis

    Broadcom Employee
    Posted Jul 06, 2012 04:06 AM
      |   view attached
    Hi cadude,

    cadude wrote:


    Will wait for the Windows 2008 document. Appreciate it.
    I was intending to add it as a proper POST to the forum section, but it got squished out of the schedule this last two weeks.

    Given that, I've attached to this post a zip containing the raw rtf document that explains how to setup a scheduled task to do the policy server "stats" on Windows 2008, and one day I will pop it with a bit more explaination in the regular forumn section.

    Cheers - Mark

    PS; It's zipped, since the screenshots blew out the rtf file to 35meg when uncompressed.

    Attachment(s)


  • 34.  RE: Siteminder Policy Trace Analysis

    Posted Jul 06, 2012 02:35 PM
    Thanks Mark.

    Really appreciate it.


  • 35.  RE: Siteminder Policy Trace Analysis

    Posted Jul 05, 2012 02:36 PM
    Hi Matt,

    Did you get a chance to update the document for the windows 2008 steps? Thanks!


  • 36.  RE: Siteminder Policy Trace Analysis

    Posted Nov 28, 2012 12:11 PM
    Hi,

    Just got my hand on this tool and it works great for STATS logs from Policy Server and I am very pleased with it.

    But I have issues analyzing normal WebAgent trace files. What I did is in the WebAgentTrace.conf I add the missing required data fields needed to get more precises reports.

    My file look like this:
    # For all Web Agents
    components: AgentFramework, HTTPAgent, WebAgent
    data: SrcFile, Date, PreciseTime, Pid, Tid, TransactionID, Function, Message

    Then, I updated my first WebAgentTrace.log file with this:
    [SrcFile][Date][PreciseTime][Pid][Tid][TransactionID][Function][Message]
    [=======][====][===========][===][===][=============][========][=======]

    Now, when I tried to run an analysis, it always give this error:
    Need 8 Fields in line, but only found 7 field :

    When I look to my log files, I do see that some lines have the correct header but other have not:
    [SrcFile][Date][PreciseTime][Pid][Tid][TransactionID][Function][Message]
    [=======][====][===========][===][===][=============][========][=======]
    Good = [CSmAdminManager.cpp:814][11/28/2012][10:38:20.552][17756][8844][][ManageAgent][Received message KEY_UPDATE_PERSISTENT.]
    Bad = [11/28/2012][10:38:20][14020][22712][000000000000000000000000192a010a-36c4-50b62fec-58b8-0276791b][ProcessRequest][Start new request.]

    Is there a way to fix this ?

    Thank you very much !


  • 37.  RE: Siteminder Policy Trace Analysis

    Posted Dec 05, 2012 02:29 PM
    I am really excited about getting this tool up and running. But when I loaded it on to my test server and I get the following error. I set path=%path%;"C:\Program Files\Java\jre1.5.0_14" What version java was the tool compiled in?

    D:\Tools\analysis\SMPolicyTraceAnalysis-1_5_0-BETA-335_bin1\SMPolicyTraceAnalysi
    s-1_5_0-BETA-335_bin>java -Dderby.system.durability=test -mx1024m -jar SMPolicyT
    raceAnalysis.jar
    Exception in thread "main" java.lang.UnsupportedClassVersionError: Bad version n
    umber in .class file
    at java.lang.ClassLoader.defineClass1(Native Method)
    at java.lang.ClassLoader.defineClass(Unknown Source)
    at java.security.SecureClassLoader.defineClass(Unknown Source)
    at java.net.URLClassLoader.defineClass(Unknown Source)
    at java.net.URLClassLoader.access$100(Unknown Source)
    at java.net.URLClassLoader$1.run(Unknown Source)
    at java.security.AccessController.doPrivileged(Native Method)
    at java.net.URLClassLoader.findClass(Unknown Source)
    at java.lang.ClassLoader.loadClass(Unknown Source)
    at sun.misc.Launcher$AppClassLoader.loadClass(Unknown Source)
    at java.lang.ClassLoader.loadClass(Unknown Source)
    at java.lang.ClassLoader.loadClassInternal(Unknown Source)


  • 38.  RE: Siteminder Policy Trace Analysis

    Broadcom Employee
    Posted Dec 05, 2012 05:20 PM
    Hi Karen,
    The tool was compiled in 1.6.x java. I currently run it fine with this version in my environment: 1.6.0_05-b13.
    - best wishes.


  • 39.  RE: Siteminder Policy Trace Analysis

    Posted Sep 12, 2013 04:36 PM
    How to generate a map.txt and filemap.txt if we are using below components and data field in our TRACE template


    components: AgentFunc, Server, IsProtected, Login_Logout, IsAuthorized, Tunnel_Service, JavaAPI, Directory_Access, ODBC, LDAP
    data: Date, Time, Pid, Tid, TransactionID, SessionSpec, SessionID, Function, ReturnValue, Domain, Realm, Rule, Policy, AuthStatus, AuthReason, AuthScheme, User, UserDN, Action, Resource, Directory, SearchKey, ErrorValue, ErrorString, AgentName, Message, Data, Query, MaxThroughput, ResponseTime, CallDetail
    version: 1.1


  • 40.  Re: Siteminder Policy Trace Analysis

    Posted Jun 26, 2014 08:45 PM

    It gets generated automatically ..


  • 41.  Re: Siteminder Policy Trace Analysis

    Posted Mar 19, 2015 09:46 AM

    Mark,


    Has this been tested using Time?

    Has this been tested using PreciseTime?

    Has this been tested using Time and PreciseTime?

    if yes to Time and PreciseTime, which one first?


    due to different people having a different preference between Time and PreciseTime, we have both  in most configurations.

    further we noticed that there are some time reporting anomalies.


    Please let me know  what  details you would like


    -Josh


  • 42.  Re: Siteminder Policy Trace Analysis

    Posted Mar 19, 2015 11:15 AM

    Notes


    1: this is the SPA being analyzed as SPS (closest choice)

    2: i think this is the trace config:


    components: AgentFunc, HTTPAgent, WebAgent, ProxyAgent

    data: Date, Time, PreciseTime, Pid, Tid, TransactionID, SrcFile, Function, Message


    verifying 2...


  • 43.  Re: Siteminder Policy Trace Analysis

    Posted Mar 19, 2015 11:51 AM

    Trace was from a different environment than i thought. Configuration verifies as:


    components: AgentFramework, HTTPAgent, ProxyAgent, SharePointAgent

    data: Date, Time, PreciseTime, Pid, Tid, TransactionID, SrcFile, Function, Message


  • 44.  Re: Siteminder Policy Trace Analysis

    Broadcom Employee
    Posted Mar 19, 2015 11:46 PM

    Hi Josh,


    If there is both Time and PreciseTime, it will use PreciseTime.


    If there is Time (and not PreciseTime) , it will give a warning, that will not be very accurate but still continue.


    Yes, SPS is closest for Sharepoint agent.


    There are a few quirks, mainly with at the log rollover times, end of last log start of new log, it does some sorting since within a log the timestamps can be slightly out of order for different threads.


    I also have latter version, (mainly bug fixes & ability to read newer PS log files) just waiting for approval before posting an update.


    Cheers - Mark


    PS: And there was one issue, with localization, when running on Japan local windows, and java date conversion had trouble parsing the months from DD-MMM-YYYY formats - but that is fixed now. 


  • 45.  Re: Siteminder Policy Trace Analysis

    Broadcom Employee
    Posted Oct 26, 2015 01:24 AM


    I've updated the SMPolicyTraceTool, distribution, this one has various bug fixes applied to it, both fixes and so that it can read & process trace files from the latter versions (R12.52 Sp1+).    There are some other trace files it now processes.


    The two newest features are :

    a) Remembering the last directory that was used, and

    b) The start of a cmd line version, runCmd.sh / runCmd.bat will gives parameters.


    26-Oct-2015 added updated version (still beta) 2.0.0-473 various fixes, remembers last directory, cmd line mode (alphaish), full list in ChangeLog.txt


    Cheers - Mark


  • 46.  Re: Siteminder Policy Trace Analysis

    Broadcom Employee
    Posted Jan 28, 2016 08:28 PM

    This post is in response to a request for some more information about the LDAPRequestPlusWait and lDAPWait sections in the psf report from the SMPolicyTraceAnalysis tool.


    Quite some time ago now I added two additional sections LDAPPlusWait and LDAPWait in addition to the graph for LDAPBank to the pdf report.


    What was the problem - why did we need another graph?


    We were not showing bottlenecks in the LDAP Request clearly enough.


    The smtracedefault.log shows times for LDAP queries :  The LDAP response times in the smtracedefault.log are like this  :


    [02/06/2015][14:58:09.753][19880][41][][LDAP search of objectclass=* took 0 seconds and 2473 microseconds][CSmDsLdapConn::SearchExts][][][][][][][][][][][][][][][][][][][][][SmDsLdapConnMgr.cpp:1128][]


    The LDAP responses of 2.5ms seem pretty good, but that was not the entire picture, and in this case the LDAPBank was the performance bottleneck - but it was not visible on the LDAPResponse time graph, as all the LDAP Responses looked very good. 


    The problem becomes clearer if we look at the prior message for that thread Id:


    [02/06/2015][14:58:09.620][19880][41][][Leave function CSmAuthUser::~CSmAuthUser][CSmAuthUser::~CSmAuthUser][][][][][][][][][][][][][][][][][][][][][SmAuthUser.cpp:1044][][][][][][][][][][][][][][][][][][][][][][][][]

    [02/06/2015][14:58:09.753][19880][41][][LDAP search of objectclass=* took 0 seconds and 2473 microseconds][CSmDsLdapConn::SearchExts][][][][][][][][][][][][][][][][][][][][][SmDsLdapConnMgr.cpp:1128][]


    Now we can see that for this thread, the LDAP request might have only taken 2.5ms, but the thread spend 131.5ms doing something else prior to executing the LDAP query which then took only 2.5ms.


    That delay or LDAPWait as I've termed it is not visible in the original graph of the LDAPResponse times.


    What is the root cause of large LDAPWait problem?


    In the example above there were 50 policy server worker threads, only one LDAPBank, and the customer was running a stress load test.


    The root of the problem is with one LDAPBank.  Each LDAPBank creates three physical connections to the LDAP server, all three are used for different purpose, and only one LDAP connection is dedicated to LDAP queries.  So with one LDAPBank we can only run one LDAP query at a time, and while that query is running if any other threads that also want to make an LDAP call have to wait until the previous LDAP command is finished.


    So if we have 50 threads all wanting to run LDAP queries, then the 50th thread would wait 2.5ms * 49 = 122.5ms until the LDAP connection is available, and then would run its own LDAP query in 2.5ms.     Also the LDAP response time is very quick, but that is because we are only running one LDAP query at a time, and the LDAP server is running low CPU.  But Av ProcessRequest time is long.


    So this delay or wait for a LDAPBank to become available is the root cause of the problem.


    How do we calculate the LDAPWait time in the tool?


    Normally in SMPolicyTraceAnalysisTool, I rely on a pattern match for a "start condition" and a pattern for "end condition", to calculate a time.  In Siteminder they are usually an "Enter function ..." and "Leave function ..." message pair.  The LDAPRequest time graph is one of the special ones that parses the [Message] line to get a transaction time.   But calculating this wait time was a bit more challenging, since for the LDAPRequest, there is not a regular previous message that indicates the start of thread requesting an LDAP search.


    So from the trace logs for each thread we have :

    [02/06/2015][14:58:09.620][19880][41][][Leave function CSmAuthUser::~CSmAuthUser][CSmAuthUser::~CSmAuthUser][][][][][][][][][][][][][][][][][][][][][SmAuthUser.cpp:1044][][][][][][][][][][][][][][][][][][][][][][][][]

    [02/06/2015][14:58:09.753][19880][41][][LDAP search of objectclass=* took 0 seconds and 2473 microseconds][CSmDsLdapConn::SearchExts][][][][][][][][][][][][][][][][][][][][][SmDsLdapConnMgr.cpp:1128][]


    And we calculate :

    LDAPResponse as the time of the LDAPRequest , as per the split timer and returned in the [Message] field.


    LDAPResponse + WaitTime is the time since the previous log message from that thread, and the log message with the split timer (so it should capture any time the thread spent waiting for access to the connection as well as the actual query time.)


    LDAPWaitTime is the difference, a high value here usually means your bottleneck is you do not have enough LDAPBanks and requests are slow because they are waiting before they can send their LDAP query.


    And then graph those as sections in the generated pdf report.  If there are delays in accessing the LDAPBank then the LDAPWaitTime graph should show that.


    What is the solution for cause of large LDAPWait problem?


    In the LDAP user store configuration screen it is common for (first time users) to specify a single LDAPBank, or a small number in load balance and failover mode.  But for optimal performance a "single" LDAPBank, is one connection, whereas what we really want for good response, is a "pool" of LDAP connections.  So obviously if you have 50 worker threads, and 1 LDAPBank, then under load and with moderate LDAP response time that single LDAPBank can easily be your load bottleneck.


    This is a very common configuration mistake, and it only becomes visible when the Policy Server is placed under load.   The normal solution is to manually create many more LDAPBank connections in load balance mode, effectively creating a "pool" of LDAPBank connections, I will post a reply with a bit more details on how. There is also an Idea request, for the SM User Store to be upgraded and support a more conventional LDAP connection pool - you can vote for that here:

    https://communities.ca.com/ideas/235718429


    Hopefully that explains the origins of these two extra sections in the pdf report.


    Cheers - Mark

    Also there is some further discussion on how do performance tuning here :

    https://communities.ca.com/people/Mark.ODonohue/blog/2014/09/04/siteminder-spiral-of-death-or-why-do-i-have-all-these-socket-32-errors-in-my-policy-server-logs


  • 47.  Re: Siteminder Policy Trace Analysis

    Broadcom Employee
    Posted Jan 28, 2016 08:45 PM

    I didn't find the exact tech note for creating a pool of connections using LDAPBanks, but this is the general method (from the enhancement request) :


    When creating a pool of LDAPbank connections, good configuration requires each individual entry to be unique.  To demonstrate the setup in the following config we have two physical LDAP/AD servers, and create three LDAPBanks with single failover:


    Edit the local hosts file to "simulate" multiple servers with unique names :

            192.168.10.22 ldap1a, ldap2a, ldap3a 

            192.168.10.23 ldap1b, ldap2b, ldap3b


    We can then create the three LDAPBank entries :

    LDAPBank1:  ldap1a, ldap1b
    LDAPBank2:  ldap2a, ldap2b

    LDAPBank3:  ldap3a, ldap3b


    Having been involved in quite a number of load testing and optimization cases by now. The optimal setup for best throughput seems to be when the number of LDAPBanks (our pool of LDAP connections) approaches the same size as the number of policy server worker threads.   There is an upper limit of number of LDAPBanks, which is around 64.  There seems to be more involved than just the sequential time waiting for the LDAP response, and with higher numbers of worker threads there seems to be also some delay navigating the locks that surround the LDAPBank.  When the LDAPBank pool size is close to the active worker thread pool size, that lock time seems to be minimized as well.


    But if you are having performance issues, and you have a single or two or three LDAPBanks, then I'd recommend try doubling them to two, or four or six, run your load test and see if you get better performance.   Then keep going until you reach your throughput target or until you do not get better performance.  


    Cheers - Mark 


  • 48.  Re: Siteminder Policy Trace Analysis

    Posted Jan 29, 2016 10:16 AM

    Just one note on the hosts file. At least in 12.52 SP1 you cannot seem to use the hosts file for the AD namespace user directory with SSL-enabled (secure connection option checked).


    It'll work for "LDAP" user directory SSL connections, but if you use incorrect hostname causing certificate mismatch to the AD one it fails when using the 'secure connection' option. Discovered this while going to implement this type of setup here.


  • 49.  Re: Siteminder Policy Trace Analysis

    Broadcom Employee
    Posted Aug 02, 2016 07:53 PM

    I've updated the SMPolicyTraceAnalysis tool :

        Last edited 1-Aug-2016 - new version 490 uploaded.


    • There are some minor bug fixes
    • The one new addition is that when you choose split-threads option, to split the smtracedefault.log into separate file for each thread after processing it will put the threads into different sub directories depending on function.


    Cheers - Mark


  • 50.  Re: Siteminder Policy Trace Analysis

    Posted Jan 06, 2017 04:45 PM

    Love the tool!


    I set up a cron job to run smpolicysrv -stats every 5 minutes but it won't pick up the thread stats.


    I am using SMPolicyTraceAnalysis-2_0_0-BETA-491.  I tried a few older builds but it's the same.


    Not sure what I am missing.


  • 51.  Re: Siteminder Policy Trace Analysis

    Broadcom Employee
    Posted Jan 08, 2017 11:22 PM

    Hi Samuel


    Thanks for the kind words, for the stats print and the threads.   The original policy servers used to output,  Current and Max threads, where "Current" was activity running threads.


    Somewhere about PS R12.51 start of R12.52 that was changed to allocate all worker threads at startup, and then "Current" always equaled "Max" and was not particularly useful.


    And so in a CR somewhere there the value of "Busy Threads"  was added, and is the number of worker threads actively involved in work.  The new graphs with "Busy Threads" should look like something like this : 


    With three values printed, but the "Busy" one having the most meaning. 


    Cheers - Mark


  • 52.  Re: Siteminder Policy Trace Analysis

    Broadcom Employee
    Posted Jan 30, 2017 07:22 AM

    Added version 494 of SMPolcyTraceAnalysis tool: two main issues fixed from release 491 - 495 :


    Fixed issue with Stats Report, when smps.log use                                                                                               localtime, the first couple of entries are still GMT 

    was throwing off the "throughput" calculation at least.


    Fixed issue with state transitions in SrcFile and similar

    graphs where last state still in transaction but is not 

    completed by end of the trace, was giving -ve trans time


  • 53.  Re: Siteminder Policy Trace Analysis

    Broadcom Employee
    Posted Jan 30, 2017 11:18 PM

    Added version 497 of SMPolicyTraceAnalysis tool: two main issues fixed from release 496 - 497 :


    And as soon as you fix one problem, that of course causes another.    


    1.13. AvTransTimeOverTime_ProcessRequest
         No Data : no data matched the selection for this graph


    Some optimization, the tool would check for each smtrace input line and run that line through all of the metrics, to ensure the <timestamp> was current and at the latest point for each metric.   This was reduced to try and call some of those if the counter is not found, only to call when skipping to the next graph interval, rather than for every input line.  


    A side effect was the AvTransTimeOverTime (which graphs the av & max times for transactions that finished in the last 5 sec),  was then  not collected - should be fixed now.


    Cheers - Mark


  • 54.  Re: Siteminder Policy Trace Analysis

    Broadcom Employee
    Posted Mar 06, 2017 03:59 AM

    Added version 498 of SMPolicyTraceAnalysis tool: 


    The Statistics format has changed in R12.52 Sp1 Cr5 to: 

    [2660/6040][Fri Mar 03 2017 14:45:03][CServer.cpp:4748][INFO][sm-Server-02000] System Statistics
    [2660/6040][Fri Mar 03 2017 14:45:03][CServer.cpp:4765][INFO][sm-Server-02020] Thread pool limit: 96
    [2660/6040][Fri Mar 03 2017 14:45:03][CServer.cpp:4787][INFO][sm-Server-02030] Thread pool: Msgs=31142 Throughput=12.258/sec Response Time=11.479ms Wait Time In Queue=0.231ms Max HP Msg=3 Max NP Msg=9 Current Depth=0 Max Depth=9 Current High Depth=0 Current Norm Depth=0 Current Threads=10 Max Threads=10 Busy Threads=1
    [2660/6040][Fri Mar 03 2017 14:45:03][CServer.cpp:4795][INFO][sm-Server-02040] Connections: Current=432 Max=645 Limit=2048 Exceeded limit=0


    Changed the SMPolicyAnalysisTool to recognise the new format (we already check for a few different older formats).  The Stats report now also plots those three attributes as well in some new graphs : 


     Plotting  ResponseTime :


     Plotting Queue Wait Time:


     Plotting Throughput per sec :


    I didn't look up the defintions of the new items, but assume they are an av value since the last plot time.  So av response time, av queue wait time, and av throughput since the last Statistics command was issued - will confirm that when I get a chance. 


    Cheers - Mark


  • 55.  Re: Siteminder Policy Trace Analysis

    Posted Aug 14, 2017 04:03 PM

    Thanks a lot Mark for sharing this. is there any possibility to add functionality to do analysis on smaccess logs in future version of this tool?


    Regards,

    Vikash


  • 56.  Re: Siteminder Policy Trace Analysis

    Broadcom Employee
    Posted Aug 24, 2017 01:53 AM

    Hi Vikash, (sorry took a while to reply) but that is a good idea, unfortunately there are a lot of good ideas and only limited time.


    In particular: it would be good to follow transaction from agent to policy server via logs, to be able to load the counters into a database, and give better control over what graphs to print; and to be able to load traces from multiple servers into a database and print graphs showing multiple policy servers and a few other things. 


    But analysis of the access log would be handy and not too hard to implement, so I expect that will happen at some stage. 


    Cheers - Mark


  • 57.  Re: Siteminder Policy Trace Analysis

    Broadcom Employee
    Posted Nov 22, 2017 12:17 PM

    Hi Mark,

    I see IDM Log analysis option in the tool, do you expect this to be working ? are you planning to enhance this option ?


    This is going to be very helpful if you enhance the IDM log analysis option. CA Identity Management


    Regards

    Ashok


  • 58.  Re: Siteminder Policy Trace Analysis

    Broadcom Employee
    Posted Nov 23, 2017 05:09 PM

    Hi Ashok, From memory, I think as it currently reports and graphs line count, and # of errors, warnings, info per timestamp.


    I had trouble becasue there was not a good "start of transaction" and "end of transaction"  tags for requests in the logs, so I could not report or graph a "transaction time".   I was looking at some of the IDM reports that were taking too long at the time.


    If you have something that would be good to count, or where I can match a start/end transaction I can include it fairly easily. 


    Cheers - Mark


  • 59.  Re: Siteminder Policy Trace Analysis

    Broadcom Employee
    Posted Nov 27, 2017 01:36 PM

    Thank You Mark for your response. Let me see how I can contribute to this enhancement.


    Thanks

    Ashok


  • 60.  Re: Siteminder Policy Trace Analysis

    Posted Jul 24, 2018 09:15 AM

    Hi Mark,


    This tool really helps many people in the community who is working on SiteMinder products.

    I could see the option for the Arcot Trace flow analysis as well, When i was using the "arcotafm.log" for trace analysis i see blank report pdf being generated.


    when i checked the report template that automatically populates on the GUI it has arcotAFMtraceitems.properties which lists the parameters about what report needs to be generated, however i couldn't modify that because of no document available. Could this be modified? or if you have documented what report to be generated that would help for the Arcot Customers to get the reports.


    Many thanks,

    Ravi


  • 61.  Re: Siteminder Policy Trace Analysis

    Broadcom Employee
    Posted Jul 25, 2018 09:27 AM

    Hi Ravi, I started the arcot trace but did not get time to finish it : 


    I also had idea to make it modular so that all one would need would be an inherited class that would read the trace file split it into fields, and a properties nominating values of fields that indicated start and end transactions. 


    But they are not finished, for the arcot fm log : 


    in the : 

     arcotAFMtraceitems.properties 


    Using  log file input lines with format : 

    #Start pattern : Flow:
    #e.g
    #2017-10-06 17:19:48,448 [https-jsse-nio-443-exec-14] INFO integrations.frontend.LifeCycleStateData(708) -> Flow: Arco
    t OTP starts. |ff7b5a4b772e0db407213cfee62785fd4ad73032


    #END pattern : Flow:
    #2017-10-06 17:19:47,707 [https-jsse-nio-443-exec-14] INFO integrations.frontend.LifeCycleStateData(708) -> Flow: Arcot OTP =OK=OK=OK=OK=OK,S#6,S#7,S#7=OK=NO=NO,S#120,S#150,S#52=collectAOTP.jsp |20171006091944.591.1f460629


    With startpattern / endpattern formats of :

    TransItem_ProcessRequest_StartPattern=Flow: Arcot OTP starts
    TransItem_ProcessRequest_EndPattern_1=Flow: Arcot OTP =OK=OK=OK=OK=OK
    TransItem_ProcessRequest_EndPattern_2=The integration type used for this flow is SiteMinder integration

    TransItem_ProcessRequest_FailPattern=Exception


    Those were my first attempt, at match start and end transactions -  but it is not complete.   As you can see with the _1 and _2 you can have multiple patterns for start and end of a transaction.  


    The log file format I was parsing was :  

              setFmt("[TimeStamp][LogLevel][LogCategory][ThreadId][Pid][Tid][Message]");


    based on :

    * group 0 2017-10-06 17:18:01,941 [localhost-startStop-1] INFO integrations.frontend.InitializeTokenSvrClientSer
    vlet(53) -> InitializeTokenSvrClientServlet for Adapter Authentication Flow Manager version 8.2.0
    group 1 2017-10-06
    group 2 17:18:01,941
    group 3 localhost-startStop-1
    group 4 INFO
    group 5 integrations.frontend.InitializeTokenSvrClientServlet(53)
    group 6 InitializeTokenSvrClientServlet for Adapter Authentication Flow Manager version 8.2.0

    group 5 could be split into category (class) and I guess the 53 is line # - maybe?


    What it needs is definitive list of Patterns in the "Message" part that starts a request, and end a request. 

    So if you can give me a better set of : 

    TransItem_ProcessRequest_StartPattern=Flow: Arcot OTP starts
    TransItem_ProcessRequest_EndPattern_1=Flow: Arcot OTP =OK=OK=OK=OK=OK
    TransItem_ProcessRequest_EndPattern_2=The integration type used for this flow is SiteMinder integration


    You can either replace it youself in the .jar file, or send it to me and I'll post you a fixed one for you to test.


    Cheers - Mark


  • 62.  Re: Siteminder Policy Trace Analysis

    Posted Jul 26, 2018 02:52 AM

    Hi Mark,


    Thanks for the reply. I will check on that will find better parameters and update here.


    Thanks,

    Ravi


  • 63.  RE: Siteminder Policy Trace Analysis

    Broadcom Employee
    Posted Oct 12, 2021 07:38 PM
      |   view attached
    Testing Version 2.0.0-Beta (Build: 693)

    Attachment(s)


  • 64.  RE: Siteminder Policy Trace Analysis

    Broadcom Employee
    Posted Oct 16, 2021 06:32 PM
    Thanks, Kim.

    These are the tools you were referring to yesterday, I presume.