Troubleshooting issues with the Intel® AMT setup and configuration process can be a daunting prospect. This series walks through the troubleshooting methods to pinpoint where problems originate and how to fix them.
Part 5: Supporting Components
Credential Manager
Pluggable Protocol Architecture (PPA)
Real-Time Console Infrastructure (RTCI)
General Settings
Managing Custom Views
Purge Settings
Corrupted Install
Troubleshooting Tools
The supporting components for using vPro AMT technology need to be properly configured for Real-time System Manager or Task Server to utilize AMT functions. The three components are:
- Credential Manager
- Pluggable Protocol Architecture (PPA)
- Real-Time System Manager (RTSM)
These components are used by a number of solutions as foundation modules. It provides the direct API interface that RTSM and Task Server use when AMT functions are called. The configuration of these pieces is vital to ensure that those modules or solutions that depend on it function correctly, especially when referencing AMT. This section covers the configuration and troubleshooting so that RTSM and Task Server function as expected.
Credential Manager
To authenticate to any protocol, credentials need to be passed. This is even truer of AMT due to the nature of the security that can be used for AMT use. Not all security protocols and features are necessarily being used, but Credential Manager holds the credentials for all of them. To access the Credential Manager Interface, browse in the Symantec Management Console under Settings > All Settings > Monitoring and Alerting > Credential Settings > and select Credentials Management.
For standard authentication, follow these steps to create authentication for AMT:
- Click Add Credentials.
- In the resulting window, select Credential type: as 'AMT Credentials'.
- Provide a Username and Password that can authenticate to your AMT Systems.
- If applicable, set an Expiration date for this specific credential.
- If applicable, select the appropriate option for 'Who should be allowed to use this credentials:'.
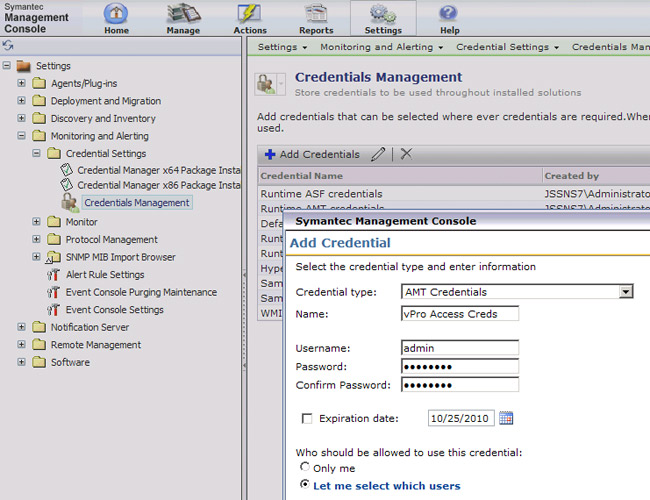
- Click OK to save the credentials.
- If you will be using a Management Presence Server for FCFH (Fast Call for Help) functionality you should also run through these same steps for that type of credentials, labeled: Management Presence Server Credentials.
- If you will be using TLS for Management of AMT, you need to run through the same steps above for the AMT NS Cert. File Credentials.
Authentication errors might relate to the credentials provided here. These credentials are typically a specified user who has full rights in AMT. The default user is Admin (the password is set when configuring AMT).
This is only the first part of configuring authentication for function use with AMT systems. Next, PPA is required to take the credentials and apply other settings and protocols to effectively manage AMT systems.
Pluggable Protocol Architecture (PPA)
Pluggable Protocol Architecture, or PPA for short, ties credentials from Credential Manager into the necessary protocols to achieve successful authentication. The PPA configuration is located in the Symantec Management Console under Settings > All Settings > Monitoring and Alerting > Protocol Management > Connection Profiles > and select Manage Connection Profiles.
Please note the following process for setting up a Profile. The Profile needs to have all applicable pieces to work properly. During this walkthrough points of failure are highlighted to assist when troubleshooting authentication issues.
To setup a Profile that contains the necessary AMT credentials for use with RTSM and Task Server, follow these steps:
- Select the Profile you wish to use (Default Connection Profile is typical).
- Click the edit/pencil icon.
- If not on, turn on the ICMP protocol, and change the settings to Timeout: 1000, Retry count: 3.
- Expand the AMT (Active Management Technology) segment.
- In the top dropdown, click the arrow and choose the credentials you created for AMT.
- Test: You can test your authentication outside of Symantec by opening an Internet browser, and connecting to your AMT system with the following template URLs:
- http://computername.mydomain.com:16992
- https//computername.mydomain.com:16993
- b. is for non-TLS, and c. is for TLS environments
- If you will be using RTSM for FCFH (Fast Call For Help) support, check the option labeled 'Management presence server requires authentication', and select the appropriate credentials.

- If TLS for AMT management was enabled when configuring your AMT systems, you need to check the option for Secure mode. Provide the necessary certificate locations and the necessary credentials.
- To determine which mode is enabled, use the following guide:
- http://computername.mydomain.com:16992, means TLS disabled, https//computername.mydomain.com:16993 means TLS enabled
- NOTE: TLS enabled for AMT management does not use the certificate provide by Comodo, Verisign, or GoDaddy for Remote Configuration. That certificate is only for the setup and configuration of AMT systems. Management is a separate cert altogether.
- NOTE! There are 2 settings at the bottom of the AMT section that are important concerning vPro Power State sleep. Due to energy star compliance, AMT may be configured to go to sleep after a period of inactive time. If you have sleep enabled, please adjust the following settings:
- Timeout: 20 seconds
- Retry after wakeup from sleep: Set to checked (enabled)
- Turn the AMT protocol on, and click OK to save the changes.
When authentication isn't working, or if the Task Server tasks or Real-Time consoles cannot connect to AMT, the following trace information will generate logs that will assist in diagnosing the issue:
To enable Trace logging for PPA/PAL, follow these steps:
- Go to Start > Run > Type Regedit > and Click OK.
- Browse down through: HKEY_LOCAL_MACHINE > SOFTWARE > Altiris > PluggableProtocols.
- Right-click on PluggableProtocols and choose to create a new Key named: "Debug"
- Right-click on the new key and choose to add a DWORD value named: "Level"
- Set the the value for this DWORD to: 0
- Create a new Key under PluggableProtocols named: AMT
- Create a new DWORD value under AMT named: TraceLevel
- Set the value for this DWORD to: 31
- Restart IIS by going to Start > Run > type iisreset > click OK.
- 1Download dbgview.exe (DebugView from Sysinternals/Microsoft) from www.sysinternals.com (you'll be redirected to Microsoft), click into the Miscellaneous section, and download Debugview. Note that you can use another debugger program to capture the trace elements, but this utility is free to download and easy to use.
- Execute dbgview.exe or preferred debugger.
- Ensure all Capture options are checked under the 'Capture' menu.
- Leave the trace running and when the error or problem is manifest, there should be corresponding entries in the trace.
- Use the Save command when trace logging in complete.
Tips for examining the log
The trace elements are not user friendly to read, but text messages should appear. The following details provide assistance when reading the trace data in conjunction with errors:
- Do not actively use the PPA nodes (under Monitoring and Alerting > Protocol Management) in the Symantec Management Console while capturing as this will generate a lot of trace data.
- Search for terms that relate to your issue, such as 'access denied' to find entries related to the failure to use AMT.
- As a reference, here are PPA entries surrounding the target system, by IP Address, and what PPA profile is being used:
00000106	325.96954346	[3828] PPA: Session::Exiting EstablishSimpleSession().
00000107	325.96981812	[3828] PPA: SessionMgr::Simple session id: 9cec05c2-807c-11df-bc94-000c2912789a for IP: 192.168.1.139 was successfully created.
00000108	325.96997070	[3828] PPA: SessionMgr::Exiting CreateSimpleSession()
00000109	325.97009277	[3828] PPA: PAL::Exiting OpenSession().
00000110	325.97402954	[3828] PPA: [CIMWSMAN PLUGIN] CimWsmanPlugin::SendCommands() called.
00000111	325.97430420	[3828] PPA: [CIMWSMAN PLUGIN] ClientBase::_Identify(): Entering
00000112	326.10748291	[3828] PPA: [CIMWSMAN PLUGIN] ClientBase::_Identify(): Leaving
00000113	326.11557007	[3828] PPA: [CIMWSMAN PLUGIN] CimWsmanPlugin::SendCommands() called.
00000114	326.12106323	[3828] PPA: [CIMWSMAN PLUGIN] CimWsmanPlugin::SendCommands() called.
00000115	326.12112427	[3828] PPA: [CIMWSMAN PLUGIN] ClientBase::_GetClass(): Entering
00000116	326.16320801	[3828] PPA: [CIMWSMAN PLUGIN] ClientBase::_GetClass(): Leaving
00000117	326.16390991	[3828] PPA: [CIMWSMAN PLUGIN] ClientBase::_EnumerateInstances(): Entering
00000118	326.43701172	[3828] PPA: [CIMWSMAN PLUGIN] ClientBase::_EnumerateInstances(): Leaving
00000119	326.44482422	[3828] PPA: [CIMWSMAN PLUGIN] CimWsmanPlugin::SendCommands() called.
00000120	326.44491577	[3828] PPA: [CIMWSMAN PLUGIN] ClientBase::_GetClass(): Entering
00000121	326.53350830	[3828] PPA: [CIMWSMAN PLUGIN] ClientBase::_GetClass(): Leaving
00000122	326.53359985	[3828] PPA: [CIMWSMAN PLUGIN] ClientBase::_EnumerateInstances(): Entering
00000123	326.68618774	[3828] PPA: [CIMWSMAN PLUGIN] ClientBase::_EnumerateInstances(): Leaving
00000124	326.69644165	[3828] PPA: PAL::Entering OpenSession().
00000125	326.69659424	[3828] PPA: SessionMgr::Entering CreateSimpleSession()
00000126	326.69668579	[3828] PPA: SessionMgr::'PPA::DeviceId' option value is: 192.168.1.139
00000127	326.69674683	[3828] PPA: SessionMgr::Using supplied Connection Profile: 78dee331-c877-435e-8ca0-9151b0496912
00000128	326.69680786	[3828] PPA: SessionMgr::Trying to create a session using IP Address: 192.168.1.139
00000129	326.69714355	[3828] PPA: SessionMgr::Using supplied Connection Profile: 78dee331-c877-435e-8ca0-9151b0496912
00000130	326.69723511	[3828] PPA: Session::Entering EstablishSimpleSession().
00000131	326.69738770	[3828] PPA: Session::Attempting to establish connection for protocol plugin id: {66100161-0768-4797-A81A-0DA2A0BF7722}
*Note that 'Connection Profile' would find this series of entries.
Useful Search strings include:
- PPA - to ensure PPA logging is occurring. Entries for PPA are prefixed with: PPA
- 10.1.10.2 - IP Address of a target system you are trying to manage via AMT.
- Computer's Hostname
- Computer's FQDN
- Can't - This can reveal messages relating to failed functions.
- Error - A generic but effective search string.
- Exception - Exceptions in the code are important to find.
- Failed - If the process fails at something, it's good to know.
- RTCI - If the failure is within RTCI, this search string may provide results.
Real-Time Console Infrastructure (RTCI)
Due to the addition of Credential Manager and Pluggable Protocol Architecture, Real-Time Console Infrastructure does not hold as much functionality as it did in the 6.x versions. There are some configuration items to be aware of, especially since RTCI still makes all the calls to both Credential Manager and PPA.
General Settings
For general configuration settings, browse in the Symantec Management Console under Settings > All Settings > Remote Management > Real-Time Console Infrastructure > and select Configuration Settings.
- Ports scan - Port check timeout: X seconds - 5 seconds is usually sufficient to allow Task Server or the Real-Time Console to check activity of a target system. However in stressed environments more time may be required. This setting can be changed here.
Symptom: Unable to connect to a machine you can ping and validate is up on the network - increase the timeout.
- Ports to Check: - Normally the default ports are sufficient for Real-Time Console or Task Server usage.
Symptom: Unable to connect, the environment does not generally use default ports. If non-default ports are used within the environment for various protocols, please add them to this section.
- Click Modify Ports link to the right of the label.
- Click the Add Port button.
- Add the Port number and provide a Port Description for ease of tracking.
- Click OK to save the new Port.

- If you need to modify a specific port, delete the original entry and add the new. By doing this you are not checking ports unnecessarily.
Managing Custom Views
To be completely honest, I have yet to run into anyone who uses the "Manage Custom Views" node within the console. The idea is that some Solutions provide custom views within the Real-Time System Manager console. If you run into a problem with these, and the Notification Server logs do not help you resolve it, please contact Symantec Support for assistance. This will be new ground as of the publishing of this guide.
Purge Settings
There are two purge policies found within the Symantec Management Console around Real-time Console Infrastructure. Here is a brief description of them:
The Purge Setting policies are automation policies, and can be further configured to take additional action when it fires, such as sending an email. Most use-cases for Automation policies don't fit into the purge functions so generally leaving these policies alone outside of change the schedule is advised.
Corrupted Install
RTCI corrupted install - This issue has occurred when multiple components that use RTCI have incorrectly installed it, creating conflicting assemblies. To fix:
- Browse to the following location on the Notification Server: install_path\Program Files\Altiris\Symantec Installation Manager\Installs\Altiris.
- Select the file altiris_rtci_7_0_kb51945_sp3_mr1_x86.msi (if the version is different than the one shown here, the file name may be different).
- With that window open, go to Start, Run.
- Now drag the MSI selected in step 2 into the 'Run' field.
- At the beginning of the resulting string, add 'msiexec.exe /x. Also add SKIPAIM=1 to the end.
- For example: msiexec.exe /fa "C:\Program Files\Altiris\Setup Files\RTCI\ altiris_rtci_7_0_kb51945_sp3_mr1_x86.msi" SKIPAIM=1.
- Click 'OK'.
- This will repair only RTCI, forcing it to refresh all files.
Continued Installation Issues
Sometimes it is required to remove a solution in order to properly repair it. As RTCI is an underlining component, how it is uninstalled is important. Use the following steps to uninstall and reinstall this component.
- Launch Symantec Installation Manager located at Start > Programs > Symantec > Symantec Installation Manager.
- Under the Installed Products list (ensure that the Filters are set to None) locate Altiris Real-time System Manager SP2 (or the latest version). This does not include Maintenance Releases as MRs do not provide the ability to uninstall.
- Click the Uninstall button.
- Click Yes to the prompt: Are you sure you want to remove Altiris Real-Time System Manager SP2 from your computer?.
NOTE: If you have a release on top of the major version, such as MR1, you'll receive a prompt indicating that MR1 will be released too. See this screenshot for an example:
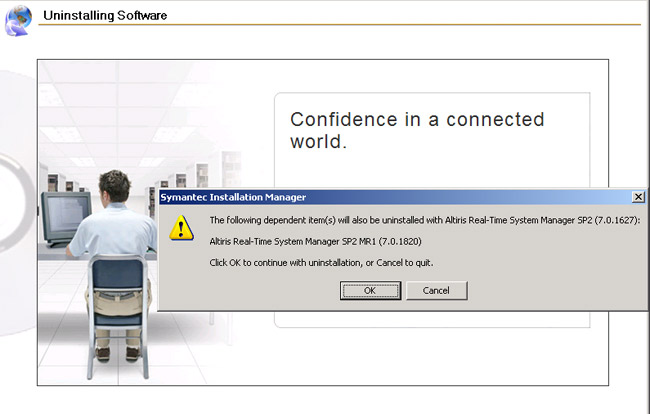
- Once complete, repeat the process with any other Solution that uses RTCI, such as Dell Client Manager which includes a Real-Time addition.
- Now remove Real-Time Console Infrastructure from the list, using the same steps as for Real-Time System Manager.
- After the uninstall is completed, click the Install new products link.
- Change the options labeled Filter: Suites to Filter: Solutions.
- Locate Altiris Real-Time System Manager in the list. When the box is checked, you'll notice that Real-Time Console Infrastructure also becomes checked as it is a prerequisite for RTSM.
- Check any other Solution you removed that relies on RTCI.
- Click Next and walk through the process to reinstall.
The uninstall/reinstall forces all files, assemblies, registry entries, and configuration executions against the database to run, usually resolving any installation problems.
Troubleshooting Tools
Because RTCI is a 'behind the scenes' module, issues with it typically show up in the modules or solutions that are using it (specifically Real-Time System Manager, Task Server, and other integrated components for Dell, etc). Once an issue identified as being RTCI, there are several methods and tools at your disposal to properly troubleshoot.
Debug Trace Logging
Enabling trace allows direct debug output to be written to a debugging program. This enables you to review what RTCI is doing when the issue being troubleshot occurs. Note that all RTSM actions are also logged through RTCI, so this trace entry can be used for both components. Use the following steps to enable trace logging:
NOTE: Depending on the version you originally installed with on version 7.0, you may have a different GUID than the one posted above. For RTCI 7.0 SP2, the Guid is: {070f8a81-4856-4494-9f13-68871833cfaa}
TraceLevel (DWORD)-Allows configuring the level of trace output to debug console or to Notification Server log. This parameter is a bit mask with the following values:
None = 0
Debug = 1
Verbose = 2
Information = 4
Warning = 8
Error = 16
NS = 32
It's recommended to set it to 1 or 2, and then use dbgview.exe (www.sysinternals.com, under Misc. Utilities, named: Debug View) to capture the trace.
The default value is Warning + Error + Notification Server, which means all warnings and errors will be traced to the debug console (e.g. DBGView or DBWin32) as well as to Notification Server log. To enable full logging only to the debug console,value 31 (decimal) should be specified. To log everything to Notification Server log specify value 63 (decimal).
NOTE: While this is documented, I've had trouble getting the Notification Server trace log to pick up the entries.
Occasionally logging will not start until you've restarted the Altiris Service and run an iisreset to refresh all settings.
TraceLevel (DWORD)-Allows configuring the level of trace output to debug console or to Notification Server log. This parameter is a bit mask with the following values:
None = 0
Debug = 1
Verbose = 2
Information = 4
Warning = 8
Error = 16
NS = 32
It's recommended to set it to 1 or 2, and then use dbgview.exe (www.sysinternals.com, under Misc. Utilities, named: Debug View) to capture the trace.
NS Trace Logging
The installed component of Real-Time Console Infrastructure logs normally to the Notification Server log. Like any component or solution in Notification Server, .NET errors or problems will be logged into the Notification Server log. For .NET errors in the console with the Real-Time tab, or within the configuration nodes for RTCI, use the Notification Server logging to capture and analyze the errors. If nothing else, you can provide the error to Support when you log a support incident to expedite the troubleshooting process.
Here is a good article on NS Logging: http://www.symantec.com/business/support/index?page=content&id=HOWTO2451
Return to Part 1/Index
Read Part 6: Real-Time System Manager