Overview

Setup ElasticSearch
- Place the ElasticSearch file ( RPM in this scenario ), onto the server
wget https://download.elastic.co/elasticsearch/release/org/elasticsearch/distribution/rpm/elasticsearch/2.4.0/elasticsearch-2.4.0.rpm
rpm -Uvh elasticsearch-2.4.0.rpm
- I'm using a gateway image for this demo, so I need to make sure I have java installed as well (Ignore if you already have java installed), if not, you can run this command from the gateway to pull it down
wget --no-check-certificate --no-cookies --header "Cookie: oraclelicense=accept-securebackup-cookie" http://download.oracle.com/otn-pub/java/jdk/8u102-b14/jdk-8u102-linux-x64.rpm
rpm -Uvh jdk-8u102-linux-x64.rpm
Since I'm using a Gateway image ( RHEL ), we are going to either need to make an entry in the software firewall ( IPTABLES ), for our ElasticSearch port, or disable it all together. B/C this is a demo, i plan to just disable iptables to simplify setup, but if this is going to be used in a production environment, I recommend keeping IPTABLES running and making the necessary holes for each port this stack requires.
- Account for port 9200 in IPTABLES ( I'm just gonna disable iptables for demo purposes )
service iptables stop
- Modify /etc/elasticsearch/elasticsearch.yml, to expose elastic search outside of localhost

service elasticsearch start
- Verify ElasticSearch is running
[root@AwesomeSauceGatewayBoss ~]# curl http://localhost:9200
{
"name" : "Angela Del Toro",
"cluster_name" : "elasticsearch",
"version" : {
"number" : "2.4.0",
"build_hash" : "ce9f0c7394dee074091dd1bc4e9469251181fc55",
"build_timestamp" : "2016-08-29T09:14:17Z",
"build_snapshot" : false,
"lucene_version" : "5.5.2"
},
"tagline" : "You Know, for Search"
}
Setup Kibana
- Place the ElasticSearch file ( RPM in this scenario ), onto the server
wget https://download.elastic.co/kibana/kibana/kibana-4.6.1-x86_64.rpm
rpm -Uvh kibana-4.6.1-x86_64.rpm
- I had to modify permissions before Kibana would start up
cd /opt
The default config expects the ElasticSearch instance to be local to the host on port 9200, which in our case, is the case. If this was not the case, you would need to modify the config file accordingly. the config file is located: /opt/kibana/config/kibana.yml
service kibana start
- Validate Kibana is running
In a browser, go to http://<kibanahost>:5601 and Kibana should load
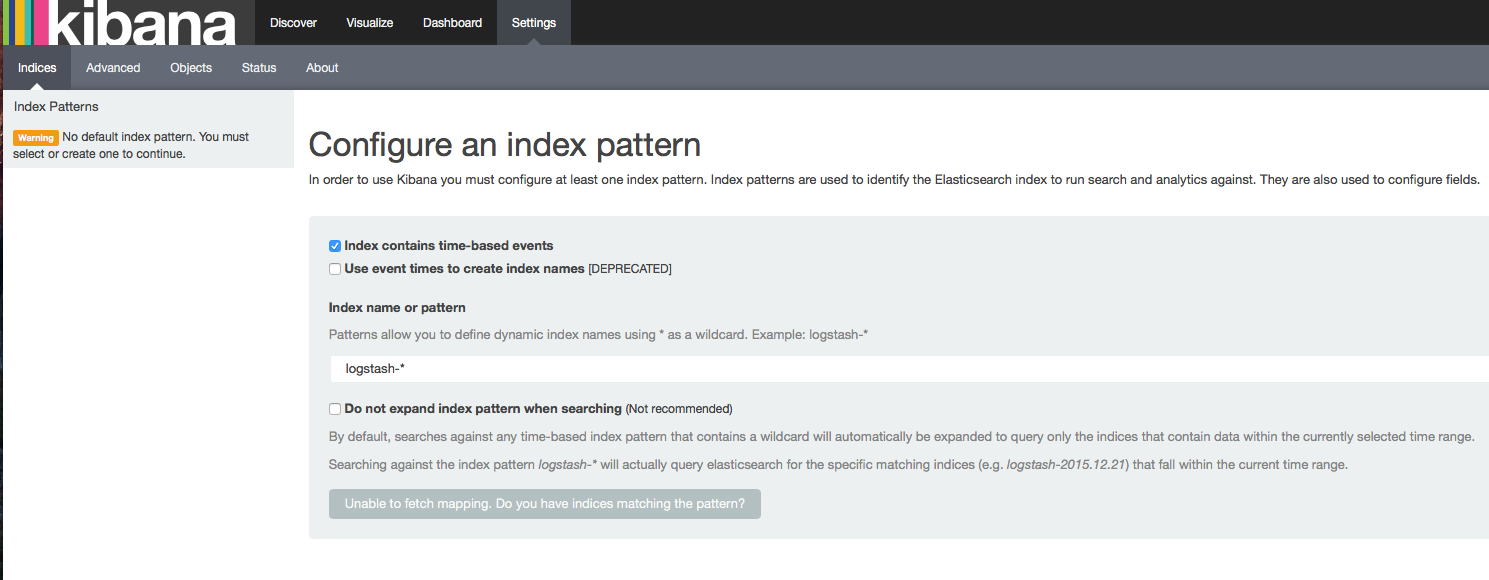
You won't see anything yet, but the app should load
Setup Logstash
[root@AwesomeSauceGatewayBoss ~]# wget https://download.elastic.co/logstash/logstash/packages/centos/logstash-2.4.0.noarch.rpm
[root@AwesomeSauceGatewayBoss ~]# rpm -Uvh logstash-2.4.0.noarch.rpm
- Pull down Config File from Github (This file is attached to this community post)
cd /etc/logstash/conf.d/
wget -O logstash.conf https://github.com/doyler86/CAAPIGateway-ELK/blob/master/logstash.conf?raw=true
- modify permissions of the conf file
chmod 644 logstash.conf
service logstash start
- Our logstash.conf file has specified a beat listener on port 5044, let's confirm it is indeed listening
[root@AwesomeSauceGatewayBoss conf.d]# netstat -tapn | grep 5044
tcp 0 0 0.0.0.0:5044 0.0.0.0:* LISTEN 15452/java
Please remember, since my logstash instance is running on the same host that Kibana and Elastic Search is running, my iptables is already disabled, if logstash is on it's own instance, then we will need to account for port 5044
Setup Gateway
- Set the cluster wide property 'trafficlogger.detail' to the following value:
APITransaction - ;service=${service.name};RequestUrl=${request.url};RequestMethod=${request.http.method};RequestSize=${request.size};ResponseSize=${response.size};TotalTime=${request.elapsedTime};RoutingTime=${httpRouting.latency};HttpStatus=${response.http.status}
- Create a Log Sink exactly as follows
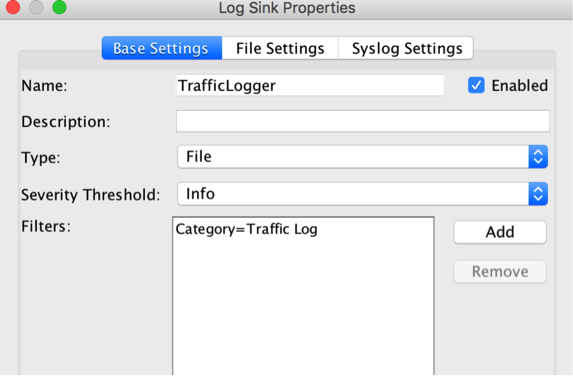
From the Gateway Node, do the following on each
Setup 'FileBeat'
wget https://download.elastic.co/beats/filebeat/filebeat-1.3.1-x86_64.rpm
rpm -Uvh filebeat-1.3.1-x86_64.rpm
- Configure filebeat ( /etc/filebeat/filebeat.yml )
There are 2 parts of the config that we need to modify
First, we need to configure which log file to monitor
YAML files are very sensitive to tabs, so please use spaces instead... this will bite you if you use tabs
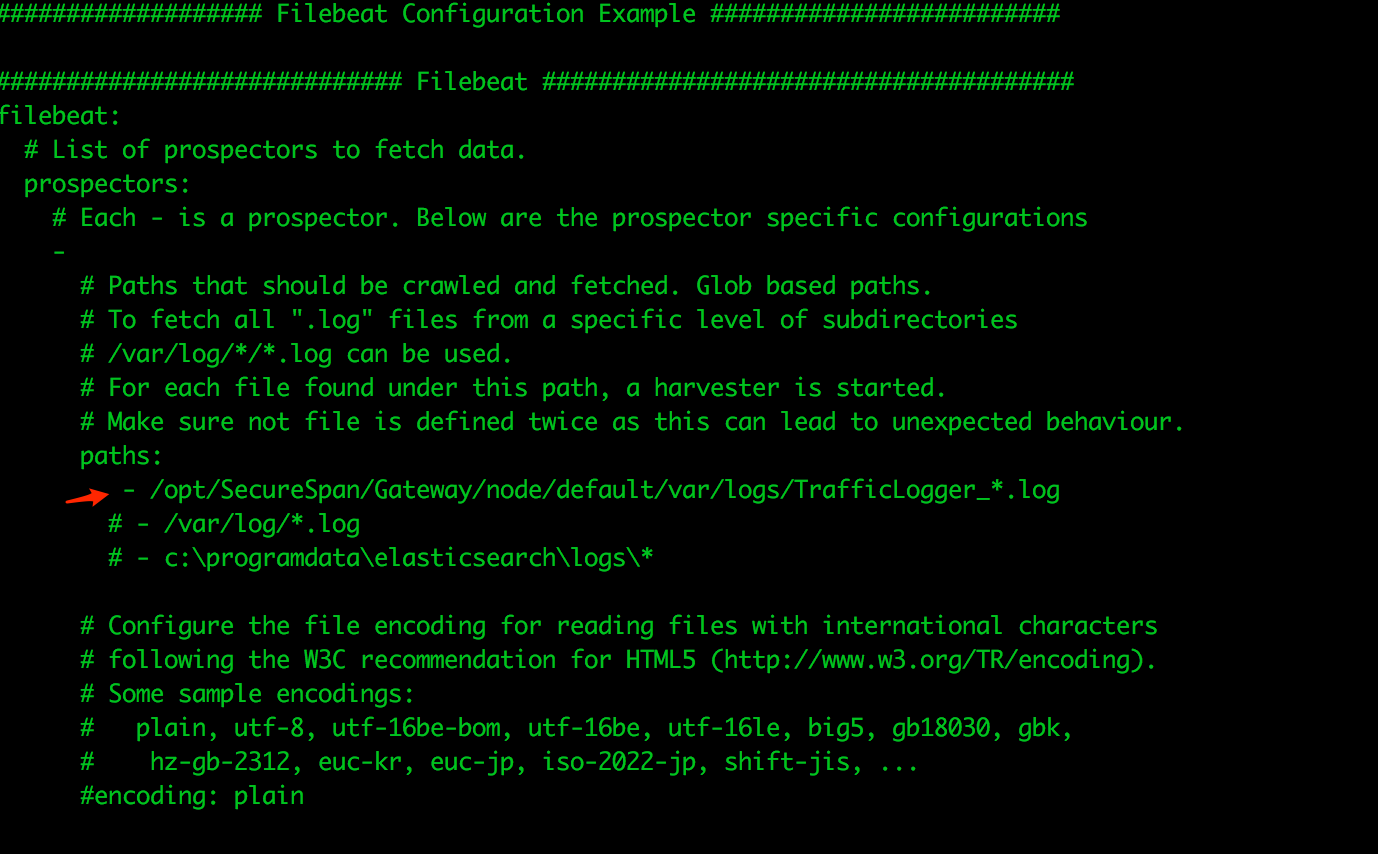
Here's the String for your copy convienance ' - /opt/SecureSpan/Gateway/node/default/var/logs/TrafficLogger_*.log '
Also, you may want to comment out the default /var/log/*.log entry, as this will just junk up ElasticSearch and put extra processing on Log Stash
- Next, we need to configure where the logs are being forwarded to... in our case, we are shipping these bad boys off to Log Stash for additional processing
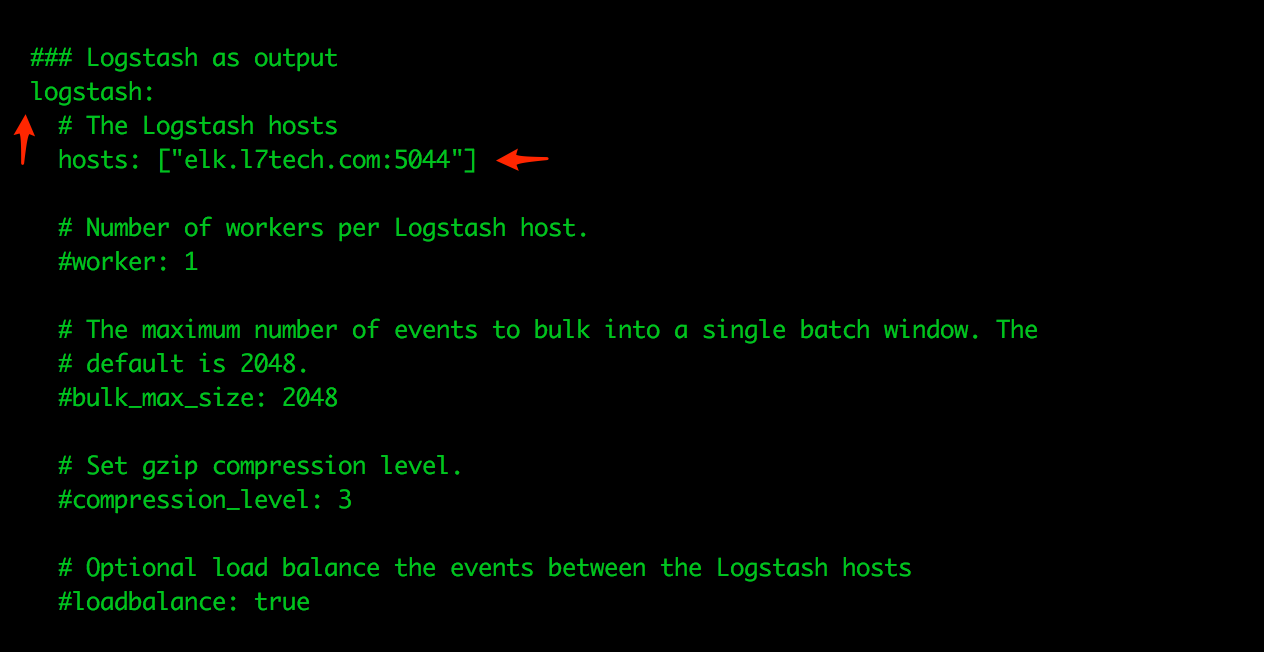
Make sure the ElasticSearch as output section is completely commented out... this could save you hours asking yourself "Why the heck is this thing not working..."

service filebeat start
wget https://download.elastic.co/beats/metricbeat/metricbeat-5.0.0-alpha5-x86_64.rpm
rpm -Uvh metricbeat-5.0.0-alpha5-x86_64.rpm
- Configure MetricBeat Config File ( /etc/metricbeat/metricbeat.yml )
We only need to make one modification in this config file, which is to point it to our ElasticSearch Endpoint
remember, we are pointing MetricBeat directly to ES, as there isn't any additional processing to the requests that need to be done

service metricbeat start
Load Kibana Dashboards