DX Application Performance Management

 View Only
  • 1.  Hide Alert Thresholds - Where to set thresholds

    Posted Aug 09, 2017 02:43 PM

    So in the Investigator - Metric Browser - Custom Metric Host (Virtual) - Custom Metric Process (Virtual) - Custom Business Application Agent (Virtual) (*Super Domain*) - By Frontend


    When you click on an application's health, on the right panel there is a button at the top "Hide Alert Thresholds".

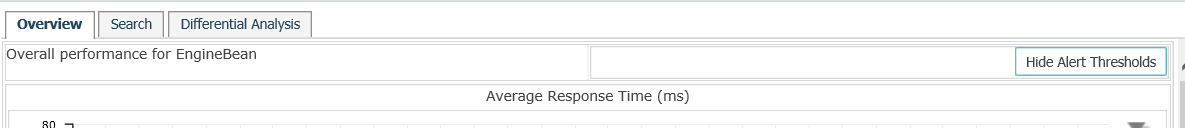
    Where and how would you set the thresholds for an application to have the red and yellow lines in the five KPI graphs?


    I've tried to define a management module and set up alerts with the "Propagate to Team Center" but that didn't work.


    Hopefully, I can avoid build dozens of new dashboards by directing the end users to use the "by frontend" on the custom host.


    Thank you,


    Billy


  • 2.  Re: Hide Alert Thresholds - Where to set thresholds
    Best Answer

    Broadcom Employee
    Posted Aug 11, 2017 12:30 PM

    Hello,

    This features is about TriageMap Alerts, go to workstation,  click Triage Map \ By  Frontends \ <your frontend>, right click Health, click  Edit Alert for ....

    See:

    Create and Use Triage Map Alerts - CA Application Performance Management - 10.5 - CA Technologies Documentation 

    I hope this helps,

    Regards,

    Sergio


  • 3.  Re: Hide Alert Thresholds - Where to set thresholds

    Posted Aug 11, 2017 03:05 PM

    Thank you Sergio.


    With the shift away from Triage Map - workstation, I've been trying to steer (not going so well) my APM end users to closer to WebView, and now, trying to gear toward TeamCenter.


    One of my end users found the button and asked.


    Thanks Again,


    Billy