Hi Manish,
Your call for dashboard templates is one of special interest, but not sure how the social dynamics of different companies will related to any other. That being said, our dashboards are, well, very tuned into what our end users have decided is important based on past events, that the over all dashboard presentation would have little or no meaning.
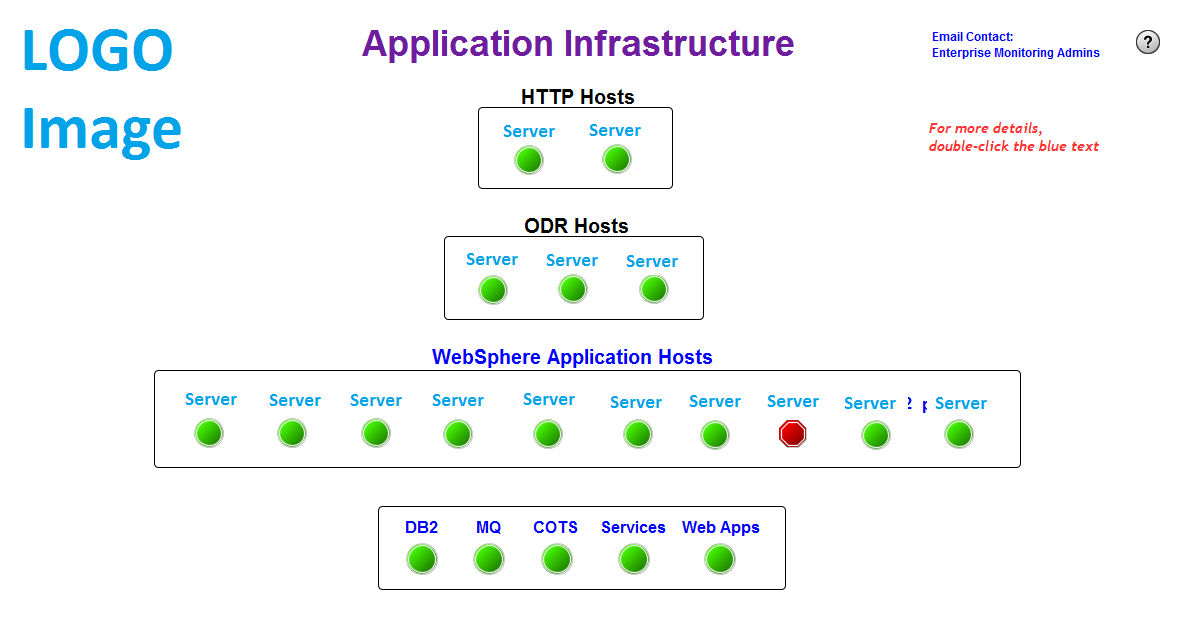
Our primary dashboard, called "The Cake" has been our primary dashboard for a large group of our end users for five years. The base premise was that the various layers (http, on demand routers, websphere application servers, applications, services, databases) were in that order and structure, were if we say a database were to have trouble, then the alerts should light up from the very bottom all the way to the top. Well, the Cake never worked that way with all of the load balancing and failover built into the various layers.
On review of our custom dashboards, we found that over 80% of our alert structure, the alerts that our end users have requested, was outside of Application Agent, but mostly at the environment performance agents that we have customized with a number of perl scripts to monitor system vmstat, netstat, procstat, df, and named processes.
For the last several years, I've struggled to shift from our custom view with our Cake dashboard, to be more focused on the actual applications, but now we get into the silos that are very well fortified with the application owners, middleware owners, service owners, database owners and infrastructure owners fragmenting. The silos are so fortified that the groups have great aversion to war-room groupings, with each group stating that it isn't their part and shutting down.
So, I'm trying to re-approach the problem using the EPIC pattern of perspectives and Team Center. The transition is becoming more daunting with trying to customize the epagents to appear within context of Team Center. Once the epagent has published a artificial application trace, then trying to get the custom alerts that are outside of the standard five application metrics, to appear and alerts to be focused on basic system resource metrics.
While this is only one of the multiple paths, with talks of pulling in Unified Infrastructure Management (CA UIM) and having the apm-gateway publish infrastructure alerts over to APM, I think we will be in the same boat since the base APM Team Center will not be aware of the UIM artifacts and will need to customize the epagent that UIM is using to do the artificial application transaction trace.
Not sure if this helps, but thought I would at least chime in.
Billy