Thanks for the input Koustubh. I tried that option, but it still breaks down the period for which service was running and divided it into intervals and shows Min, Avg and Max TPS for each dividing point.
Here the requirement is as follows:
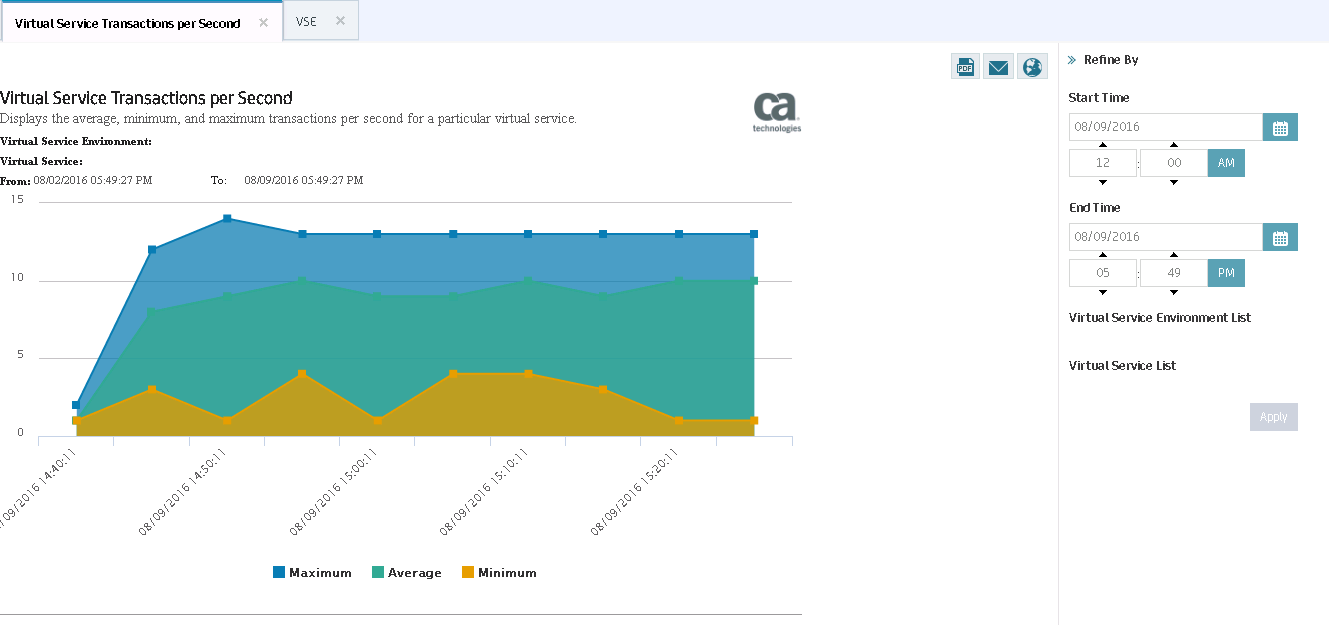
Assume a VS service was running from 14:30:00 to 15:30:00 and processed certain requests during this time. Now I would like to know what was the total transaction per second count at exactly 15:03:00. Can I get this information?
Also would I like know how Min, Avg and Max TPS is calculated for a given point in time as depicted by the points in this graph. As I understand for Min, Avg and Max there was to a time interval under consideration. What is that time interval considered when we show this data on Portal graph.