
CA APM collects and visualizes a wide range of data from your application environment. You can now tap into that data and create your own customized dashboards with the Grafana integration for CA APM. Grafana is an open-source tool that lets you send RegEx queries to the APMSQL database over a JDBC connection. Grafana then collects the query results in a stream of JSON files, which are compiled into dashboards.
Let's Give it a Try: Track Response Times of Frontend Components
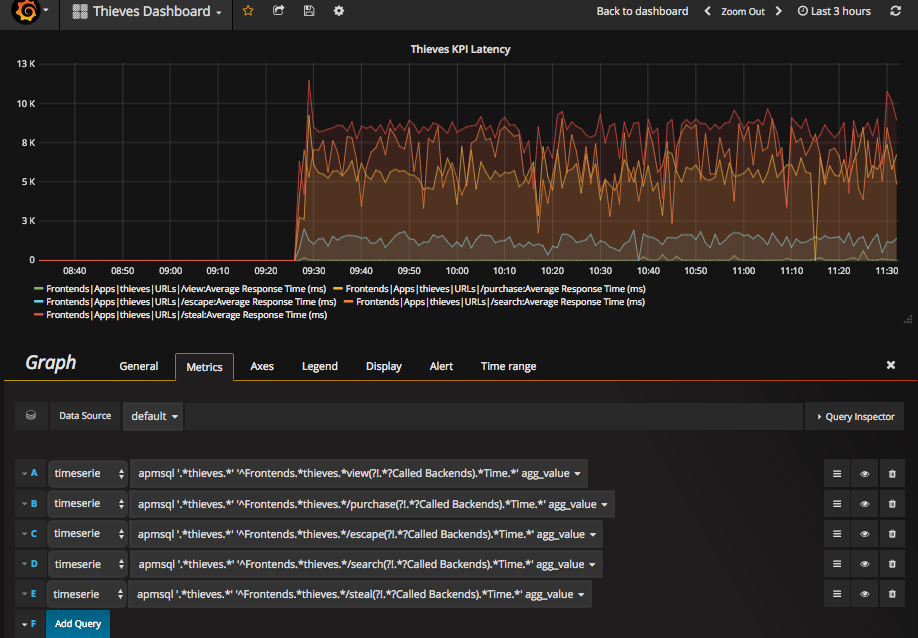
Suppose you want to track the response times of your frontend components and compare them side-by-side in one comprehensive chart. To do this, execute the following query in Grafana for your enabled frontend component, in this case, the /purchase component. You can also expand the query to include any other desired frontend components:
apmsql '.*thieves.*' '^Frontends.*thieves.*/purchase(?!.*?Called Backends).*Time.*' agg_value
Result:
 What to Do and What to Read
Go to Using Grafana with CA APMSQL for further information about the Grafana setup process. The Grafana Getting Started Guide contains a tutorial on building your first dashboard.