Hello,
I setup a StalledMethodTracer (see my previous thread on how to set the nameformatter correctly: https://communities.ca.com/message/241701595#241701595) for certain service methods of the application we are monitoring. The goal is to have a Counter how many request within an interval are slow and how many are very slow.
Thus for testing purposes I set this time to be very low, in order to see the metrics in our testing environment. I also added a MethodTracer to see the timings.
SetTracerClassMapping: SOAPStalledMethodTracer com.wily.introscope.agent.trace.StalledMethodTracer com.wily.introscope.probebuilder.validate.StalledMethodTracerValidator
SetTracerParameter: SOAPStalledMethodTracer nameformatter [package].nameformatter.soap.SOAPNameFormatter
SetTracerParameter: SOAPStalledMethodTracer reentrancy instance
SetTracerClassMapping: SOAPBlamedMethodTimer com.wily.introscope.agent.trace.hc2.MethodTimer com.wily.introscope.probebuilder.validate.MetricNameValidator
SetTracerParameter: SOAPBlamedMethodTimer nameformatter [package].nameformatter.soap.SOAPNameFormatter
SetTracerParameter: SOAPBlamedMethodTimer useblame true
TraceComplexMethodsWithThresholdIfFlagged: [FLAG] SOAPStalledMethodTracer "TEST|Frontends|ByService|{Service}:Slow" 10
TraceComplexMethodsWithThresholdIfFlagged: [FLAG] SOAPStalledMethodTracer "TEST|Frontends|ByService|{Service}:Very Slow" 20
TraceComplexMethodsIfFlagged: [FLAG] SOAPBlamedMethodTimer "TEST|Frontends|ByService|{Service}:Response Time"
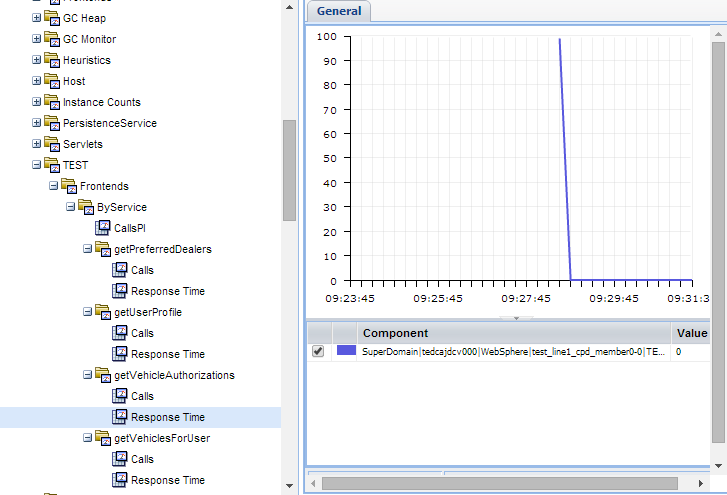
When I run this configuration on our testing environment I nicely see the Response Time per {Service} ({Service} is produced by the nameformatter), but I do not see "Slow" and/or "Very Slow". This had me puzzling as the Response Times are higher (sometimes 100ms) than the set threshold of 10ms / 20ms (please see attached screenshot - I have a perintervalcounter as well that produces "Calls" - I removed that from the configuration above for clarity reasons). Do you have any idea what I do wrong?
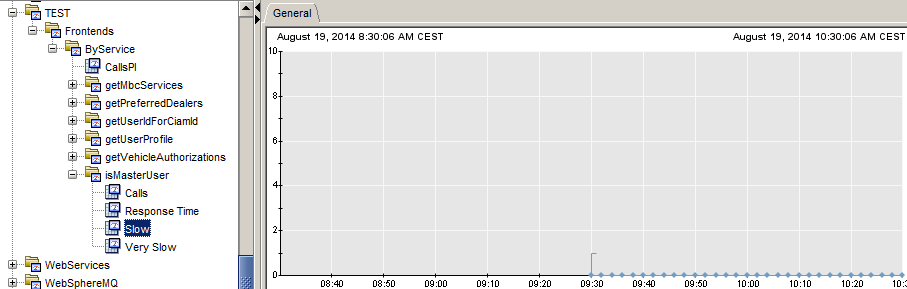
Edit: After some time I found a Slow and VerySlow metric. So basically my configuration should be correct. I just do not understand why I dont get the metric for all response times that are higher than the threshold. At 09.30 we had a very long response time (~4800ms).

For that I did get a Slow and Very Slow metric:
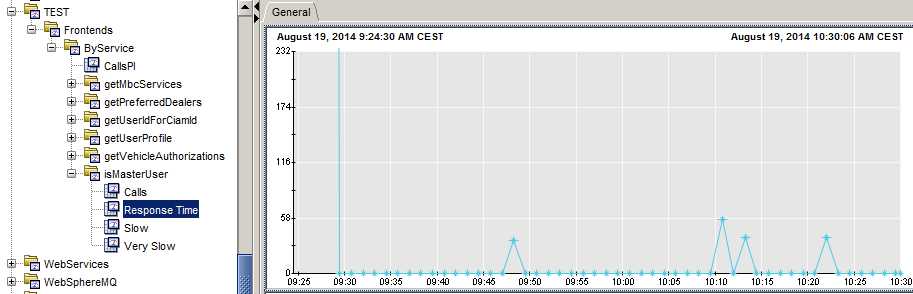
But why dont I get the metric for the next peaks for the response time. We see here times of 40 - 80ms in average, which threshold defined as 10ms and 20ms so all of them should also be counted to the slow and very slow metric.
Thank you,
Stefan