Hi,
Yes. I made it. Following the procedure I enabled the configuration in the secondary hubs where I have problem. I set it to level nine compression.
In LOG I see the result of compression.
However, my tunnels continue to turn red. If I turn it off and on, it turns green for a while and right after, red. From time to time it returns to normal and red again.
The strangest thing is that I see the status of the tunnel connection as active. But the response time is abnormally high.
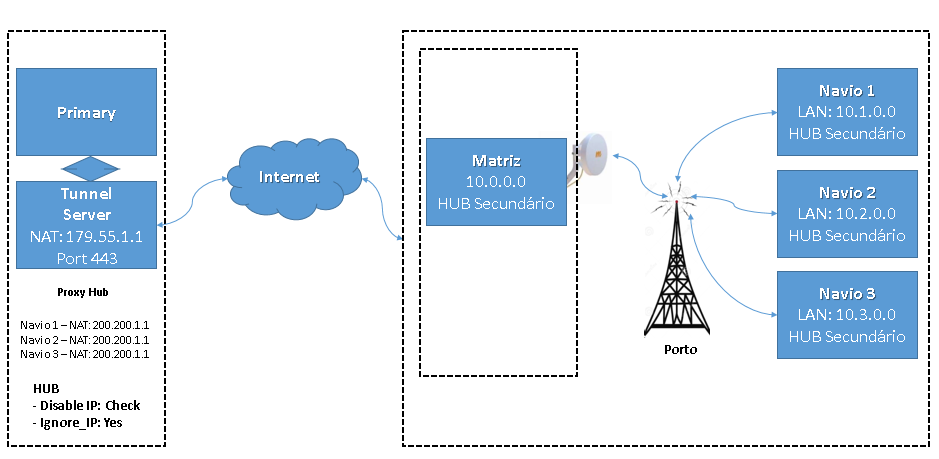
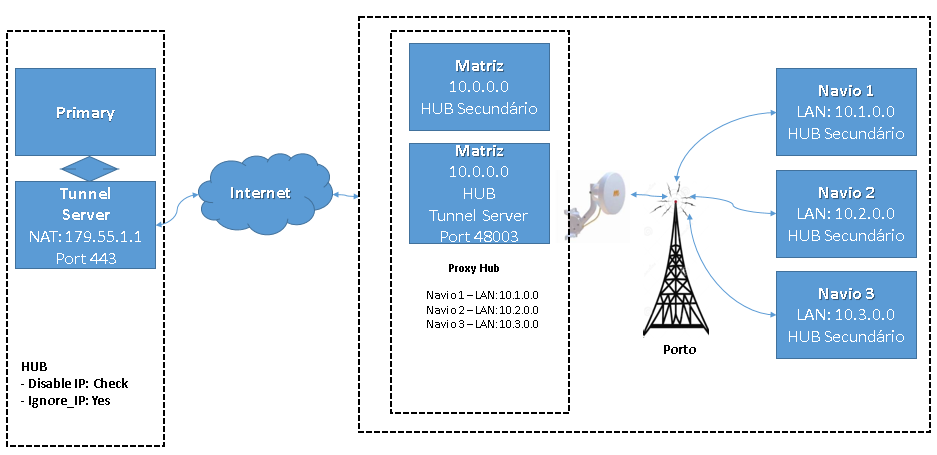
NOTE: All secondary hubs arrive in the tunnel (proxy hub) with the same NAT, as they pass through the central office. So I set the tunnel server to "ignore_ip" and "disable_ip".
I will add the images below.
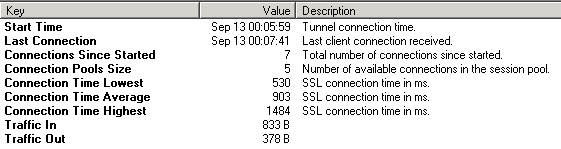
Hub Secundary 1 with Datacenter (Tunnel - Proxy HUB)

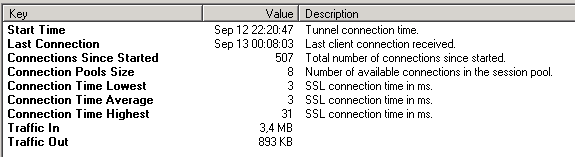
Hub Secundary 2...5 with Datacenter (Tunnel - Proxy HUB)
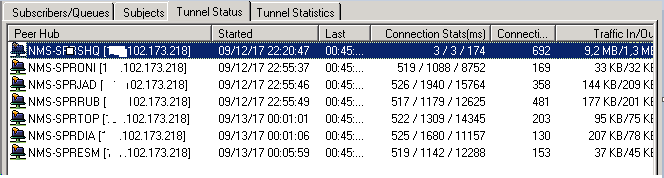
Central Office with Datacenter (Tunnel - Proxy HUB)
Status connections all:
Try since this occurs only for a group of five sub hubs, and since the other secondary hubs are working perfectly, I ask you to validate whether my strategy can help reduce this problem.
I currently have a primary and a tunnel server, doing the proxy hub function. That is, for these secondary hubs with high latency, we dedicated an exclusive tunnel, doing proxy hub and delivering to the primary alarms and qos.
But the tunnel (proxy) is in a datacenter and these secondary hubs connect to it using the Internet from the central office. That is, the secondary hubs communicate by radio (backhaul network) with the central office and use the Internet to communicate with the datacanter where the server tunnel is.
I am thinking of the client's central office, creating a tunnel server, so that the secondary hubs communicate directly with the central office and this tunnel (hub hub) concentrates the alarms / qos and sends it to the datacenter tunnel.
With that, I would avoid one of these jumps and consolidate all the alarms and qos in the client's office.
I'm adding the current and proposed scenario:
Scenario Actual
Scenario Proposed
Thanks for the opinions.