I don´t know if anyone have showed how to do this before, i´ve searched the forums and didn´t find anything related.
The idea here is to be able to bring the interface utilization when you hover your mouse over on top of a link representation.
Today you can use the lines to create a link representation, but some customer´s technicians still debate over this plugin functionalities.
So, how to represent something similar in UIM?
I´ve exported the models i did, they are very simple and you can change the qos for the one in your interface, and use some pretty graphics, which i didn´t cause i did this during the training session from CA which is happening right now.
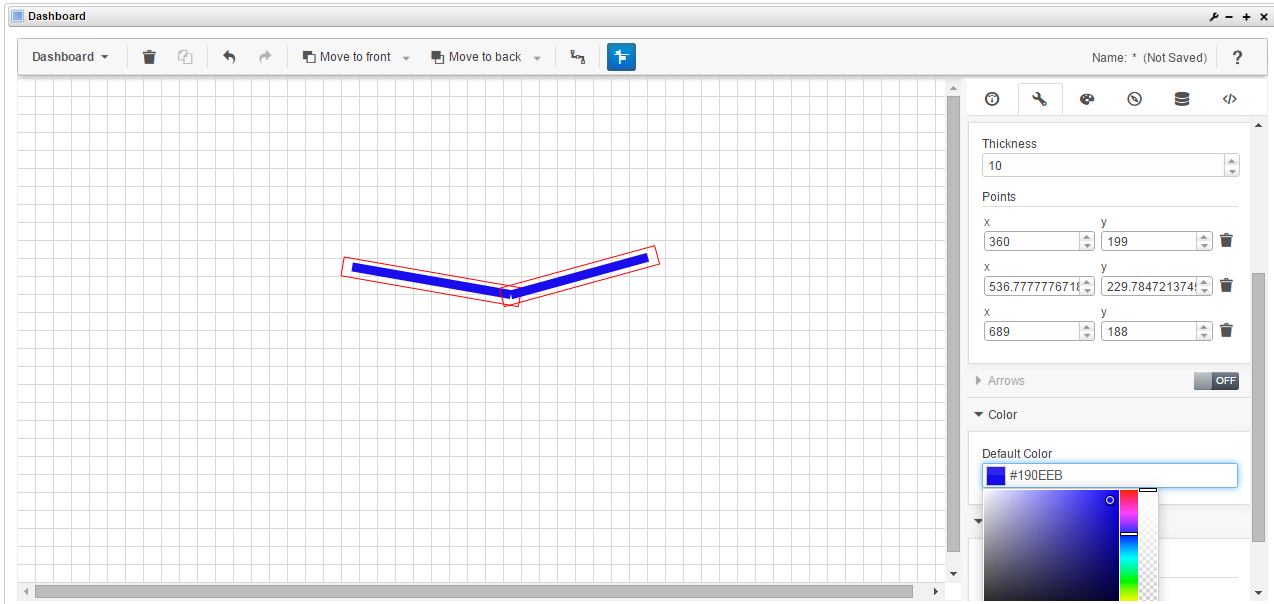
Basically you create a line, with the threshold colours, and after that select it, click Widget Properties and inside the field URL you insert the code for it to work.
That works, because the dashboard accepts html input directly inside its fields, not only what tells you it does.
Easy steps:
1 - Create a line widget with a QoS in a separated dashboard, publish it and get the url from the published page.

That url will be used inside the <iframe src=> tag.
2 - Create a line, define que QoS you want, and define the colour thresholds.
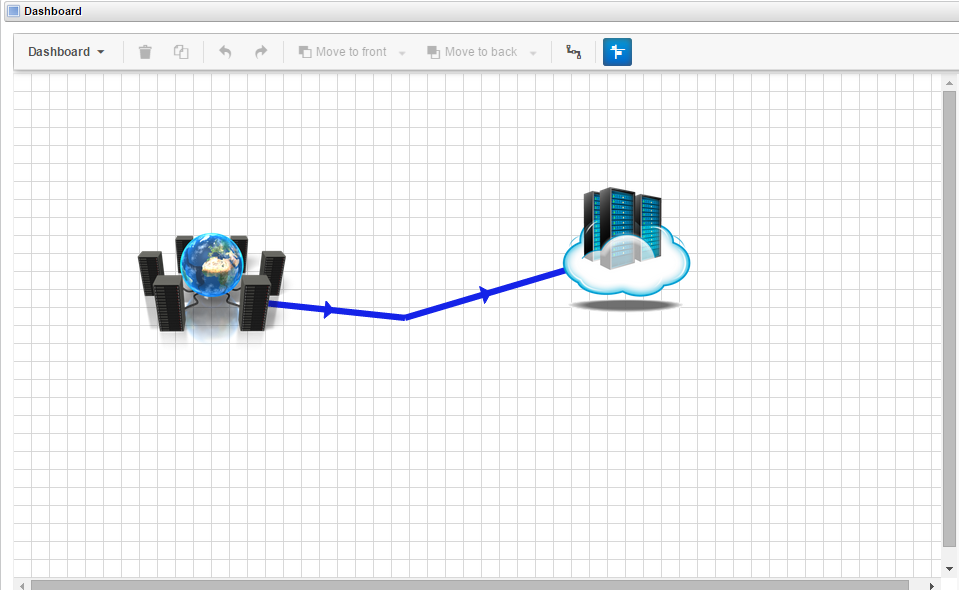
3 - Create the nodes with whatever images you want, you can put status changes on those also.
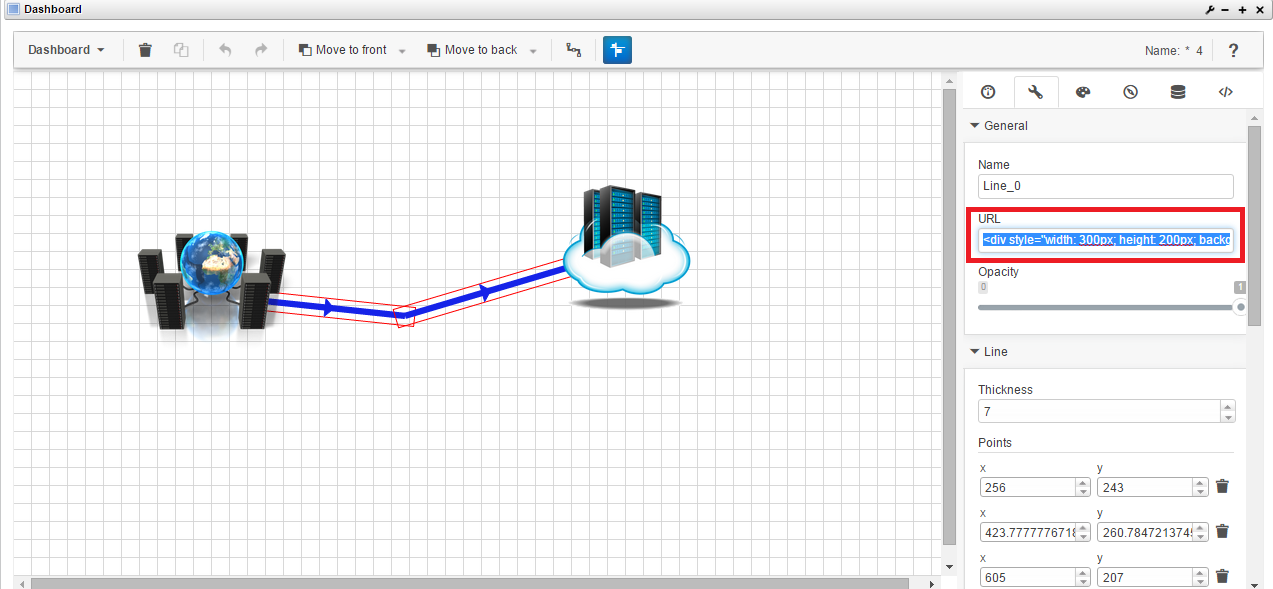
4 - Select the line you created with thresholds and stuff, click Widget Properties and insert the code provided inside the "URL" field like bellow:
Don't forget to replace the example url with the one for your own graphic.
<div style="width: 300px; height: 200px; background-color: white;"
onmouseover="document.getElementById('div1').style.display = 'block';"
onmouseout="document.getElementById('div1').style.display = 'none';">
</div>
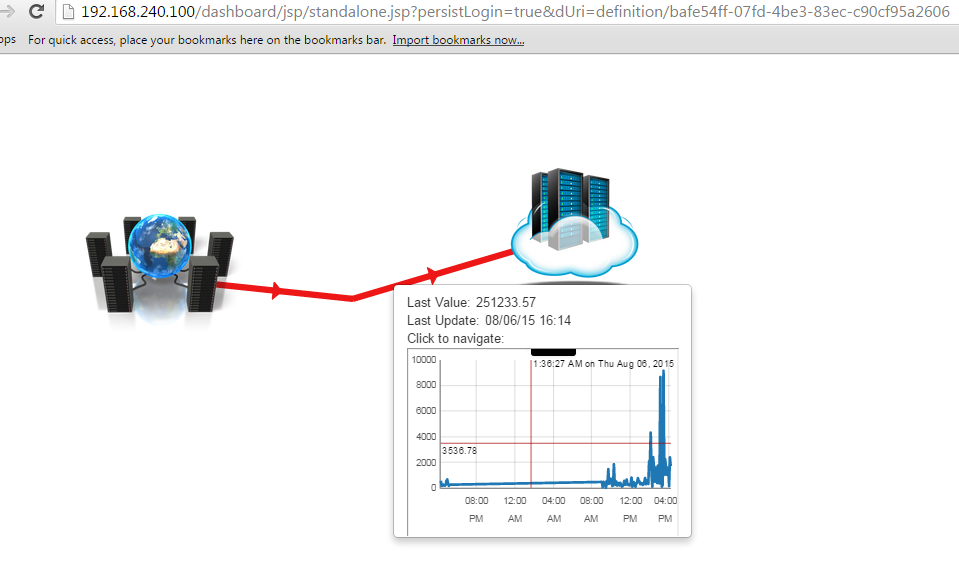
5 - Save the dashboard and publish it. Click "View Published Version". Hover your mouse over the link and then over the white area of the box that will appear, the graph will load inside the white area very quickly.
6 - Create your own weathermap style dashboards with nice pics, topology design and stuff, and enjoy!
Plus now you can say that you can replace weathermap (all other tools) with just one solution - UIM!