Theodore Levitt’s widely quoted theory, “People don’t want to buy a quarter-inch drill. They want a quarter-inch hole,” gains new relevance when discussing business outcomes that PPM systems and processes enable. Part 1 of this blog will focus on CA PPM Jaspersoft reporting in terms of purpose and process, in addition to my consistent usability focus. Check out the entire series .
CA PPM has many powerful out-of-the-box reports that make data transparent, and enables scheduling and distribution. These reports are built based on industry best practices and can be leveraged by organizations at many levels of system and process maturity; just one reason that Gartner ranks CA PPM an industry leader. That said, I propose that these technical capabilities are only half the story when we’re talking about creating business value.
As a CA Services Architect, I often see customers recognize CA PPM Jaspersoft reporting’s simple yet powerful experience for the end user:

However, I also see that coin’s flip side; when customers feel the pressure of “with great power comes great responsibility.” What I mean is that organizations may want to leverage a tool, but become overwhelmed with reporting options and data that lies outside of their scope of process and system maturity. An analogy to this is my MS Office license: I use some applications heavily, like PowerPoint and Outlook, and don’t use Publisher and Access. This a la carte model, even though the entire suite is available to me, is typical; but many organizations do not take this approach with CA PPM and Jaspersoft reporting.
Availability to unnecessary functionality may cause a “needle in a haystack” complexity issue, and deteriorate value perception. As discussed in many of my blogs, we need to streamline data entry, focus reporting output and remove the “noise” of other functions. PPM reporting must be tailored to each organization’s needs at its current maturity level/ability to consume. I will discuss how we as PPM practitioners can align this tool at the appropriate level for our organizations, as to build a foundation to grow from.
When employing PPM reporting techniques to deliver business value, rather than starting from the question, “What can the tool do?” the better question to start with is, “What outcome do we need to gain?” Beyond basic process and system capability knowledge, the specific business needs, not the tool, should be the driver.
In this post, I am not speaking about analytics and formalized report requirements. I want this information to be adaptable and adoptable within your unique organization, so, below is a simple questionnaire that I use when creating High Level Designs. This approach will also help build organizational readiness and overall usability, which in turn enables PPM value delivery.
- What question does the report answer?
- Why is this report important/what business outcome does it support?
- Where in the PPM processes is the report consumed?
- What is the cadence of this report? (input and output)
- Who are the process actors for this report? (input and output)
- What is the desired functionality of this report? (probing links, click-ins . . .)
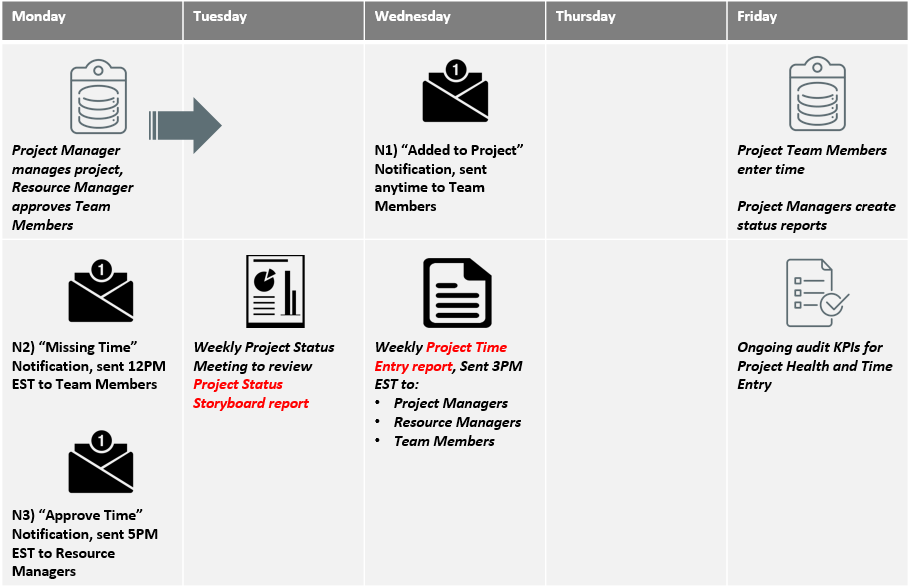
In addition to report delivery, data quality audit and notifications play a large part in the solution’s success. Below is one of the formats I use when designing PPM report and notification specifications. The schedule and details below support the “Project Status Storyboard” and “Project Time Entry” reports. Notice that 6 process and system steps are identified to enable the 2 reports. I like to call this the cadence and context calendar:
Whether an organization is building new PPM functions or enhancing previously implemented, it’s imperative to clearly define the criteria for each report. Organizations should retain and support only reports that deliver high value and jettison reports that don’t. Your end users will thank you for getting rid of the “noise” of low-value data.
After establishing a report baseline, consider drawing a roadmap for future maturity. When looking at report portfolios, I identify what the actual output addresses; if it is looking back, analyzing the current state, or adding proactive awareness:

For readers interested in more detail, CA World is the perfect time and place to see presentations and demos. If you haven’t registered yet, you can do so here. I also encourage you to participate in the best-in-class site, where you have access to communications, events and support. In addition, you can reach out to CA for individualized business outcomes references and analysis. Feel free to post in the comments section of this blog or contact me directly via email and Twitter @PPMWarrior.