"On the fourth day of APM 9.7, the CA Team gave to me… Smart Instrumentation "
4th day – Smart Instrumentation - Seeing all that matters!
Travelling all over the world working with our customers and consultants on building the perfect Application Performance Management solution, I have the chance to review and audit many different applications and architectures.
At almost every engagement I’m getting asked: “What matters? What to alert on? What’s important to monitor in an application? What do I need to see to tell my application is working correctly?”
Monitoring what matters
By looking into a single application, it doesn’t matter whether it is a .NET instance, a JVM or any other type of application - I always go for the application boundaries first.
Monitoring the entry points into an application is most important. By showing the protocol and if possible even more like a mapped URL, Queue, Topic or RMI interface I know everything I need to know about the application quality. With the “Frontends” in place I know about the quality of the application, response times, errors and the functionality being used.
The time of standalone communications handling the end user requests and doing all the business logic with maybe only database connectivity is gone. We live in a world of Service Oriented Architectures and Enterprise Service Busses. Most applications make use of synchronous and asynchronous communications to other applications. Understanding their health is directly dependent on the called Service Layer or Application.
This leads us to the second most important monitoring point, the information on all outgoing calls of the application. The “Backends” should tell me the protocol being used, details of the call and the target of the call.
This concept of monitoring the “Frontends” and “Backends” is something we call the Boundary blame and our solution is doing an excellent job by discovering those and combined with some other features they conclude into the “Boundary Blame Concept”
“Always three there are, no more, no less…”
By rewriting the big “Rule of the Two” and adding one more important component we have to focus on the “Controller” layer.
With controller I mean the application logic. What’s happening inside? What is the application doing? And there is always something important to look at. Even if the application’s only job is to transform an inbound HTTP call into a Web Service with the help of some information from the database, I want to see this transformation step.
Also if the application is just a Portal getting some information via RMI from another application but also does excessive work on enriching and rendering that data, I want to see it.

Let’s have a look at this new feature
So, there is now since the 9.6 release earlier this year this new feature in our product called “Smart Instrumentation” and my blog today is bringing it to a test.
The promise is to show me everything that matters in a Transaction Trace. It should show components which are important in a transaction even though they are not instrumented via our out of the box instrumentation. An intelligence to identify complex methods, important methods, potential troublemakers and calls to special API’s I’m using.
For my validation of the feature I chose my very challenging real world test application. On purpose I removed all instrumentation on what’s happening in the middle, the controller layer and everything else.
For the first test run I also deactivated the Smart Instrumentation feature.
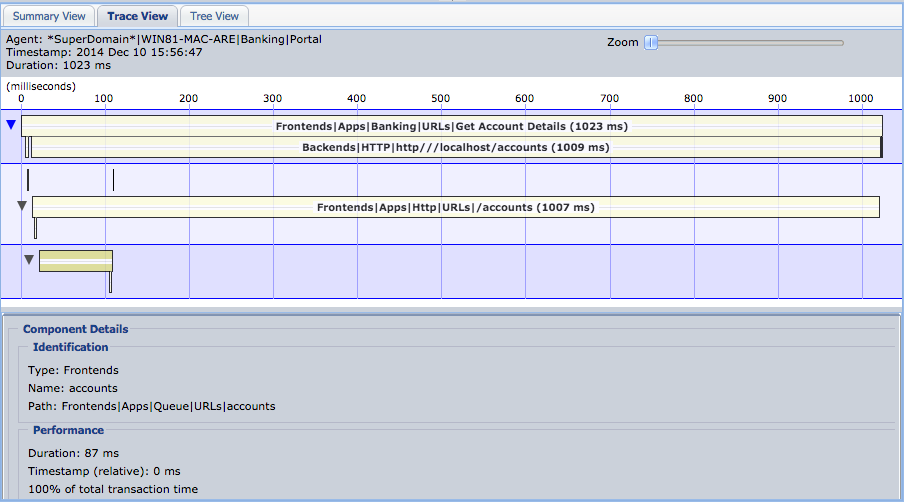
I have pretty good coverage of the application boundaries for each JVM. I can see my Frontends and Backends and a little bit more across my three JVM’s.
Let’s enable “Smart Instrumentation” and see what the new feature will give me.
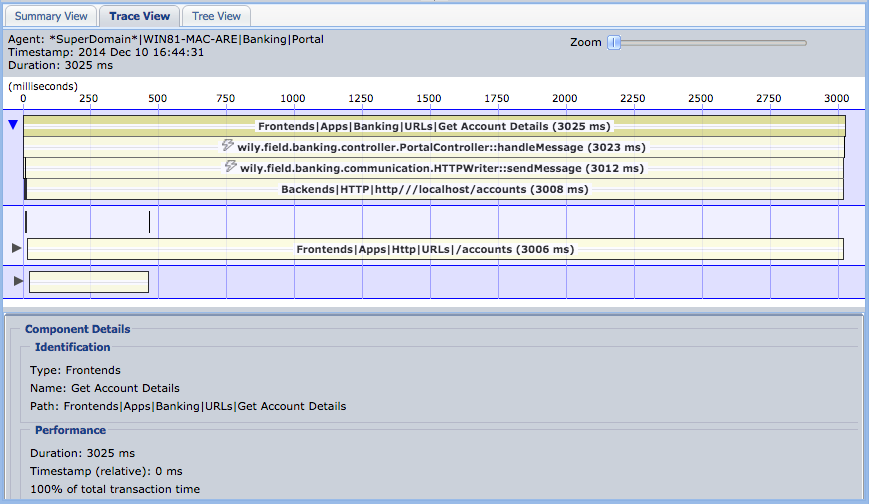
Beautiful, we do have important components discovered and indicated with a lightning bolt. But let’s take a closer look focusing on the Portal layer.
I agree my test application doesn’t have much logic but it is my best indicator on features and monitoring verification. I couldn’t have done it better myself by extending Introscope. Everything what I would look for is there.
Smartness and Error Handling
I will go a little bit further and explore how the new Smartness can help me in error situations.
For this purpose I will shutdown the JVM receiving HTTP requests from the Portal to produce some errors.
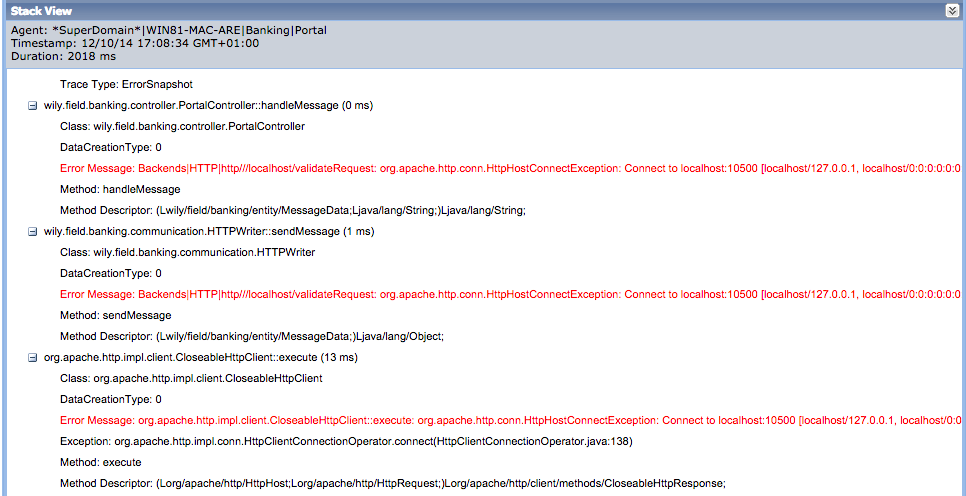
Nice, I have an error event showing the related Boundaries of the request and even more the full detailed call path combined with smartly discovered components. In addition the connection error with all the error handling stack.
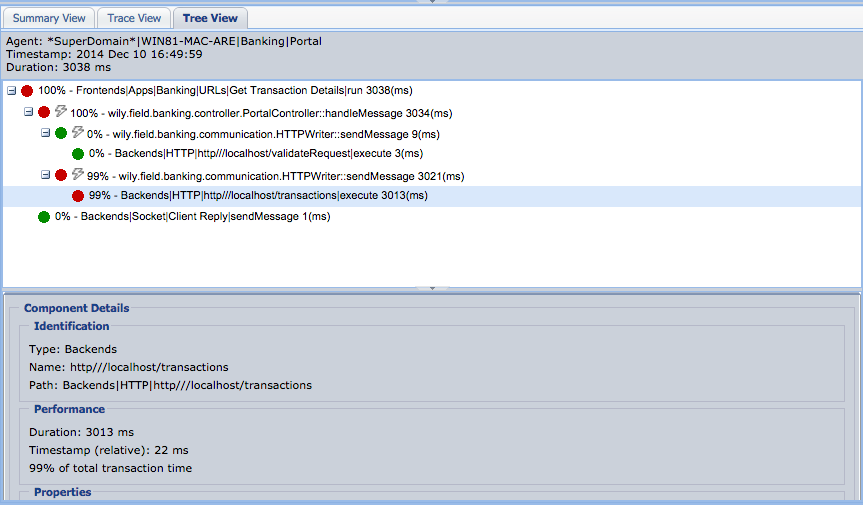
But how about a request being stuck somewhere? I used a more simple Web Application were I was able to produce a transaction, which doesn’t return and is stalling.

And the result is excellent. I have a complete Stall snapshot with the stuck thread and all the details I need.
Smart Instrumentation, job well done. Introscope shows me components that matter and the results are not blurred with getters and setters or redundant components. It shows with all the details the result of key components in the transaction with unlimited depths.
I was even promised that there will be much more Smartness and also an integration with other APM features to come.
Happy Holidays!
--------------------------------------------------------------------------------------
The 12 Days of APM Blog Series
Twelve (12/19)
Eleven (12/18)
Ten (12/17)
Nine (12/16)
Eight (12/15)
Seven (12/14)
Six (12/13)
Five (12/12)
Four Smart Instrumentation (12/11)
Three Mobile App Analytics (12/10)
Two APM Command Center (12/9)
and an E.P.I.C APM Strategy (12/8)
———————————————————————————————————————————