Overview
Many discussion and question threads in the Community ask for assistance and guidance on performance tuning DevTest components. There is no single approach to improving DevTest performance. Likewise, there is no single, authoritative list of "do this and your system will be optimally tuned" settings. As with any application, tuning takes time, effort, and repeated attempts to find the right combination of settings that maximize the performance of a system. Settings that work on one system may or may not work on another.
This Tech Tip comprises a miscellaneous set of notes for some of the more common performance tuning settings within DevTest. The tips identified here are not guaranteed to work in all versions of LISA/DevTest nor are they guaranteed to resolve your specific performance issues.
Disclaimer
Treat the following as a compilation of hints that may or may not improve performance.
Never implement any of these hints without executing load tests to determine the effect of the setting on your installation.
Use an Enterprise Database
By default, DevTest ships with a Derby database. This database should not be used when performance testing.
Disable CAI / PathFinder
Continuous Application Insight (a.k.a., PathFinder) creates additional load on the Agent Broker. In local.properties on machines hosting your performance runs add:
Restart your servers after applying the change.
Reduce Logging
By default, DevTest's logging.properties file is set to INFO level. For performance testing, make the following changes:
- log4j.rootCategory=WARN,A1
- log4j.logger.VSE=WARN, VSEAPP
Reporting (Staging Documents)
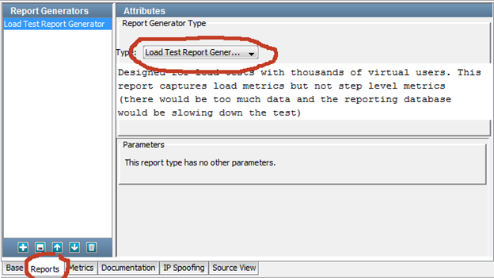
Load Test Report Generator (Staging Documents)
Staging documents default to use a functional report generator that reports on events including information pertaining to each request / response. Executing a performance test with staging documents set to functional reporting can add additional load into the database. Use a report type of Load Test Report.
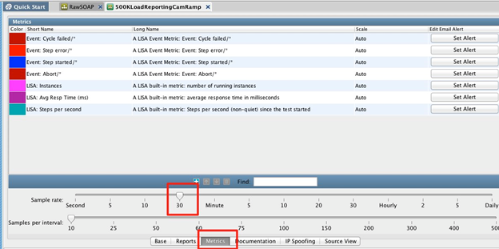
Metric Intervals
For large scale tests, set the metric interval to 30 seconds. This means that every 30 seconds Simulators send their metrics to the Coordinator server.
Test Cases
Limit Looping
Do not allow looping within a test case to go on indefinitely. If necessary create an "exit" in the looping test case using a numeric counting dataset. If errors occur in the test case, this will generate a more manageable error report on failure.
Make Sure Your Test Case Will Stop
If a test case is written improperly, a load test that is scheduled to stop after a certain period of time might not stop. Consider the following:
- There is a dataset on the first step in the model.
- The dataset is specified as Global (allows the dataset to be controlled by the Coordinator).
- The dataset is configured to "End the Test" when it runs out of data.
lisa.properties and Other Settings
Depending on whether the load is related to Test Automation (Simulators) or VSEs (virtual services), one or more of the following settings may be applicable,
- lisa.CycleExecHistory.buffer.size=2 This setting reduces the amount of history each VSE worker thread keeps. The result is reduced heap utilization and CPU savings.
NOTE: Do not simply apply the following settings because they are listed here. Apply settings only after running test executions and carefully determining the effect each setting has on your particular load test(s) and environment. For example, determine bottlenecks using tools such as jstack to determine how many threads are blocked inside the EventHandler class waiting for the queue to be drained before increasing the lisa.eventPool.maxQueueSize parameter.
- vse.socket.reuse=true
- lisa.net.timeout.ms=60000
- lisa.net.xstream=false
- lisa.coordinator.kill.on.exception=false
- activemq.msgCompression=true
- lisa.dcm.maxExpandPerLoadChange=50
- lisa.jpm.MaxInstances=5000
- lisa.jpm.unlimited=false
- lisa.overlaodThreshold=30000
- lisa.eventPool.maxQueueSize=65535
VMOPTIONS
General JVM Memory Considerations (VMOPTIONS)
- Decide on the total amount of memory you can afford to give to the total heap
- Grant memory to the young generation unless you find problems with excessive old generation collections or pause times
- Tune maximum parameters first: The basis for tuning assumes the system is equipped with enough system resources like CPU and memory.
- Do not fix overall heap size by setting –Xms and –Xmx to be equal unless the application needs large amount of memory at start up
The most common adjustment is to increase the amount of memory available to a DevTest Server. These settings are applied in the server's VMOPTIONS file located in LISA_HOME/bin.
- -Xmx3096m increase the memory allocation pool
Java 7
For systems running Java 7, the Coordinator, Simulator, VSE servers may benefit from memory and garbage collection tuning parameters. Review the relevant materials on determining how the JVM is functioning prior to using these settings. To view Garbage Collection details use:
- -XX:+PrintGCDetails Outputs information at each garbage collection event
- -XX:+PrintGCTimeStamps Outputs time stamps at start of each garbage collection event. Commonly used to view the percentage of time spent in GC.
After careful analysis, it might make sense to switch GC strategies. To do so, these settings may be helpful.
Java 8
Oracle removed PermGen and replaced it with Metaspace, a native memory allocation governed by the OS. It is theoretically possible for memory allocations to increase to a size that can cause the server to run out of memory. The use of too much Metaspace can cause obvious issues.
Examine Metaspace on Unix using the top command and on Windows using the Task Manager.
One option for controlling metaspace is to provide a JVM option:
Unix Sockets
When running on Unix and performing tests involving HTTP, consider increasing the number of open sockets:
# bump up # open sockets allowed from 1024 to 11k
ulimit -n 11000
/etc/init.d/httpd start
nohup lisa/bin/Simulator -remoteInit
exit 0
Other Helpful Commands
ps -eLf = print PIDs and threads underneath
/proc/<pid>/task = threads under a process
ps huH p <pid> | wc -l = count of number of threads -1 to account for counting the headers
cat /proc/sys/kernel/threads-max = limit on the total number of processes on the system (threads are essentially just processes with a shared address space on Linux)
jmap –histo <PID> = list objects consuming the Heap Space
Performance Tuning Data Driven Virtual Services
The link Performance Tuning of Data-Driven Virtual Services - DevTest Solutions - 9.5 - CA Technologies Documentation contains guidance related to tuning Data Driven services.
Reference Materials
http://www.journaldev.com/2856/java-jvm-memory-model-memory-management-in-java
http://www.oracle.com/technetwork/articles/java/vmoptions-jsp-140102.html
http://docs.oracle.com/javase/7/docs/technotes/tools/share/jstack.html
http://docs.oracle.com/javase/7/docs/technotes/tools/share/jps.html
https://docs.oracle.com/javase/8/docs/technotes/guides/vm/enhancements-8.html
http://docs.oracle.com/javase/8/docs/technotes/tools/windows/java.html
http://docs.oracle.com/javase/8/docs/technotes/tools/unix/java.html
https://docs.oracle.com/javase/8/docs/technotes/tools/unix/jstack.html
http://karunsubramanian.com/websphere/one-important-change-in-memory-management-in-java-8/
http://www.oracle.com/technetwork/java/gc-tuning-5-138395.html