Upgrade to APM 10
So you have been using CA APM for years. You know it as Wily or Introscope. And you are monitoring 100s of applications with it. Your APM cluster is maxed out or you have several APM clusters. Users are still mostly using the workstation - at least you are. You have created 10s of Management Modules, 100s of dashboards and probably 1000s of alerts. And now you (have to) want to upgrade to APM 10.
Well, you might do yourself and your APM users no favor. And here's why:
APM 10 Team Center
APM 10 will create a relationship map (similar to the old Application Triage Map) from your traces - so you better not disable transaction trace sampling or your map will remain empty. APM 10 will create vertices (or simply nodes) from your Frontends, Backends, Servlets, ... and will connect them with edges. Well, that's what a map (or a graph) is all about, isn't it? That map is the basis for everything in Team Center: dashboards, filters, perspectives, even permissions.
Alert Mapping
Then APM 10 will map your alerts to the nodes on the map. If you alert on Average Response Time of Frontends it will map that and show the corresponding alert statuses (what's the English plural of status? In Latin it would be stati) on the map as there will probably more than one alert that maps to each node.
Well, you have 1000s of alerts and you have tuned your APM cluster to have a Harvest Time and SmartStor Duration under one second. But now all the metrics in the alerts will not only be evaluated for the alert (that may result in an action like sending an email, an SNMP trap or an event to your event console) but they will also be evaluated against the vertices on the map. That's an operation with an order of O(n²). That means if you double the number of agents you will have four times as many matching operations (twice as many nodes x twice as many metrics, see Big O notation on Wikipedia).
Alert Spamming
But you already have 100s of nodes on the map and at least 100s of alerts (APM will evaluate every metric in a metric grouping that defines an alert, so those are probably 10,000-100,000). And all of this will be evaluated in every 15s interval. So you better protect your APM cluster and your APM users from alert spamming because just this computation may take longer than a 15s interval.
Here's a screenshot from a customer that I worked with recently:
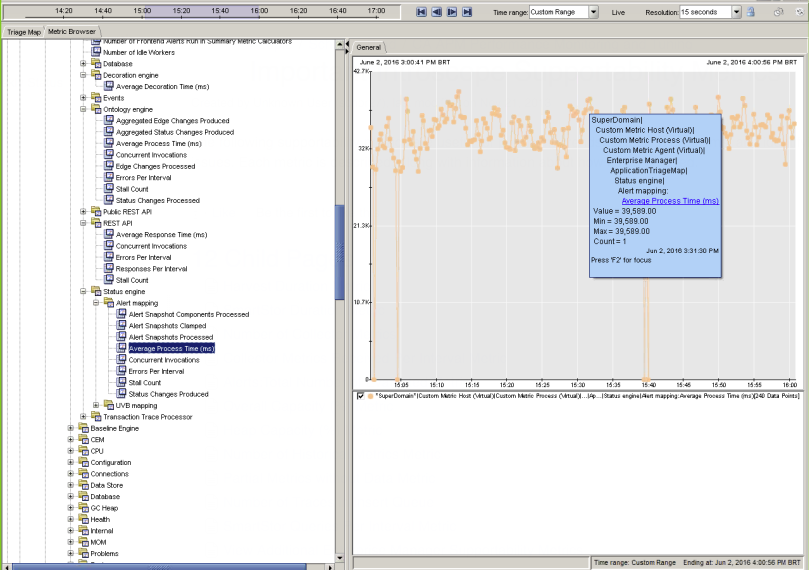
You can see that the metrics Enterprise Manager|ApplicationTriageMap|Status Engine|Alert mapping:Average Process Time (ms) has a value of 39K. So it takes the Enterprise Manager 39s to compute that alert status mapping for the map. No wonder the EM CPU is very busy (it increased by 15%) and the map in APM Team Center does not update. It takes the EM more than 2 harvest cycles of 15s to compute the mapping!
So here's another screenshot. Just go to *SuperDomain*|Custom Metric Host (Virtual)|Custom Metric Process (Virtual)|Custom Metric Agent (Virtual)|Enterprise Manager, click on the Search tab, enter "Alert" and click Go:
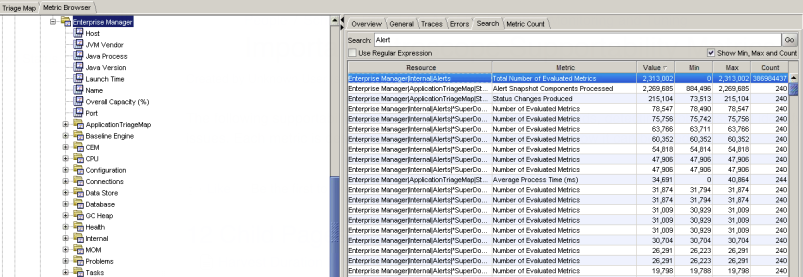
2.3 million metrics are evaluated every interval - and the EM is doing fine. Only when it has to match these 2.3M metrics against 1000s of vertices it becomes a problem.
What can you do?
We wanted to make all the work you have put into CA APM to show up on Team Center. So we enable the new flag "Propagate to Team Center" for every existing alert when you upgrade. Probably this wasn't the best idea. So you have to disable the flag for every alert. But you have 100s of alerts set up" Clicking through every single one of them is probably boring and not the best use of your time. (It still might be more interesting than some other things we have to do in our jobs ). But you'd rather go home early and have a beer with your friends, a movie with your girlfriend or some time with your kids. As it turns out, you can ...
Script it
As you might know, a Management Module is just a jar file containing a ManagementModule.xml and maybe some images (if you have been very diligent). And if you extract that ManagementModule.xml and search for "Alert" you will find:
<AlertBase xsi:type="AlertType" PropagateToAppMap="true" IsActive="true" DescriptionContentType="text/plain">
So you just need to do the following:
- Copy MM.jar from EM_HOME/config/modules[/domain]
- Backup the old MM.jar
- Extract ManagementModule.xml: jar/unzip -xvf SampleManagementModule.jar ManagementModule.xml
- sed -Ei 's/ PropagateToAppMap="true"/ PropagateToAppMap="false"/' ManagementModule.xml
- Repackage: jar -uvf SampleManagementModule.jar ManagementModule.xml
- Delete the old MM and copy new MM to deploy folder (the EM won't redeploy over an existing MM)
Test it on a non-production system first!
Being very naughty
You just discovered there are tons of Management Modules and Alerts configured. But which ones are really used? You can find out if you disable the alerts by replacing IsActive="true" with IsActive="false". If your phone doesn't ring or your Inbox explode then nobody has been using it anyway. I trust you to do this in a reasonable way! You probably know how your APM users will take it
If you just remove a few alerts or whole Management Modules - you just increased the capacity of your APM cluster, saved some energy and reduced climate warming! You're a hero. In the worst case, you only prevented your cluster from alert spamming and yourself from working with my awesome colleagues from CA support to repair your cluster.
And with a responsive APM Team Center you and your APM users can explore the goodness we have delivered in APM 10 and how we will continue to make your and their job easier with the things to come!
More on APM 10 and Upgrading