|
If I told you that enterprise IT organizations are playing the game “Guess How Many Jelly Beans Are in The Jar” with their Virtual Machines (VMs), would you call me crazy?
|

|
Image provided by: cbgrfx123, Flickr.com
Enterprises are under constant pressure to maximize their infrastructure utilization. To do this, they often push to increase VM density with increased workloads per server. This quickly becomes a balancing act between maximizing server utilization and ensuring adequate application performance without server congestion and exposure to risk of hardware failure.

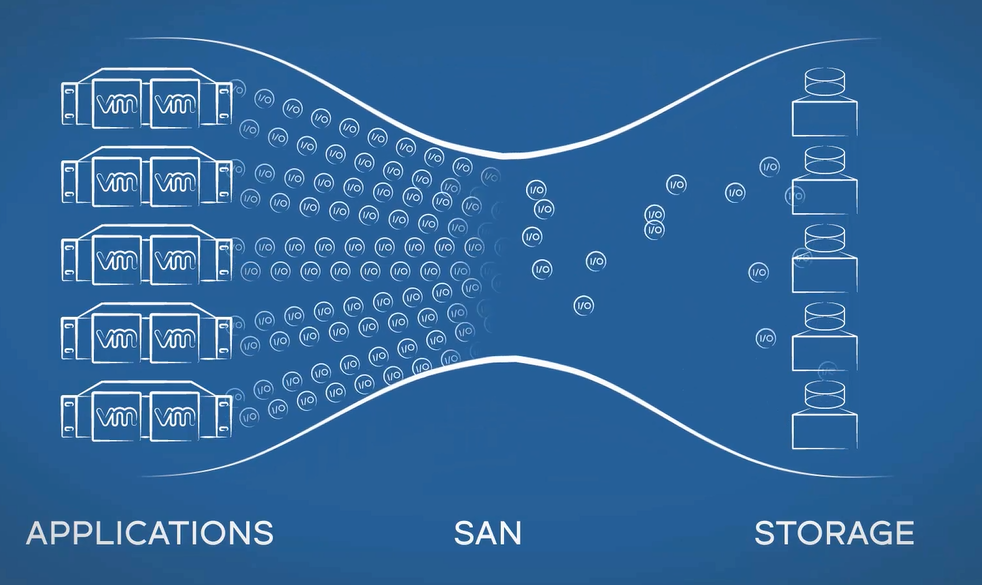
Complicating things further, different applications strain the physical infrastructure differently. This means in a highly consolidated environment with an exponential growth in virtualized traffic, it’s nearly impossible to identify if your resources are all consumed by a few resource-intensive databases, ERP apps, or a group of smaller but more frequently used applications like Adobe reader or SharePoint. To help prevent server resource constraints, critical applications might be “fenced off” on dedicated vSphere clusters in an attempt to guarantee adequate resources to meet SLAs. This is a great approach to guarantee the CPU and memory necessary for an application, but once that application needs to read or write to storage, the infrastructure disregards the cluster isolation and views the request as any other blend of traffic. Consequently, this complicates the process of fulfilling SLAs from a shared storage infrastructure.

To better manage the balancing act, IT organizations need to have centralized monitoring of their physical infrastructure combined with monitoring of the virtual layer. This is the primary challenge because most vendors only have the capability to monitor end point devices and rely on SNMP traps or API access to deliver post event statistics. Then it becomes a guessing game of when the congestion impact will happen again and at what cost to operations.
This is why the Fibre Channel standards (T-11) group introduced the ability to carry the identification of individual VMs across the storage network. VMware is the first hypervisor to take advantage of this capability. By applying the interpretation of Gen 6 Fibre Channel standards-based VM identification, Brocade VM Insight allows the storage administrator to pinpoint issues not just on a physical server, but down to the specific VM workload. VM Insight is a feature within Brocade Fabric Vision and leverages Fabric Vision Flow Monitoring and IO Insight to provide granular insight into the application health and performance residing on each VM.

Brocade IO Insight provides the ability to monitor and trend the conversations between servers and storage. IO Insight does not monitor what information is being shared but rather the Meta data of how many conversations are being had, for how long, and identify any behavior changes. Some of the technical details it monitors include:
- Total IOs at a flow level to monitor workload profiles over time
- First response times (maximum and average) for an IO request
- IO latency for Exchange Completion Time (ECT), maximum and average
- Outstanding IOs in the queue, maximum and average
Applying Brocade VM Insight into the IT infrastructure will enable administrators to seamlessly monitor their VM performance and give them the ability to quickly determine the source of VM/application performance anomalies and take any remedial action. It will also help them meet service-level objectives by helping them provision and fine-tune the infrastructure based on VM/application requirements.
To learn more:
#BrocadeFibreChannelNetworkingCommunity#Gen6FC#Storge#virtualization#brocade#vmware#fibrechannel