"On the sixth day of APM 9.7, the CA Team gave to me… MongoDB Monitoring "
On 6th day, let me talk about MongoDB Database Monitoring leveraging the new RESTful API support in CA APM SDK known as EPAgent (EPA) introduced with the release of CA APM 9.7 .
CA APM team partnered with MongoDB to deliver CA APM Collector for MongoDB that provides an E.P.I.C. solution for enterprises running MongoDB database to identify and resolve MongoDB performance issues and integrate the database metrics into CA APM for intelligent analytics, alerting and visibility on a single dashboard. No software install is required directly on MongoDB servers; metrics are retrieved via the mongo client (installed anywhere), processed by the collector process and forwarded for integration into CA APM.
CA Technologies is also a MongoDB Partner and has certified CA APM on MongoDB Enterprise.
The CA APM Collector for MongoDB Database leverages recently announced update to the SDK known as EPAgent (EPA) to support RESTful API . As you may know, the CA APM EPA is a stand-alone Java application with a wide range of features for collecting data to send to the CA APM Enterprise Manager. EPA was designed so that customers could, as easily as possible, integrate any data into CA APM – even information about the state of the garage door, lego robots, etc. EPA was originally designed for customers to register script “plugins”, either in “stateful” (e.g. log reading) or “stateless” (e.g. CPU or OS stats.)
Some APM customers had needs that weren’t met by creating an EPA and running it local to an environment – the footprint of the agent and scripts were too expensive, or the process of installing an entire EPA to collect the data was inconvenient. Now with APM 9.7, a REST-compliant interface of EPA is available where metrics can be submitted in batches over a RESTful PUT operation. This is the preferred interface (more efficient) now. The EPA can be configured to listen to a network port for metric data from arbitrary remote systems. Specifically, one port can be set to listen for XML-formatted metric data, and a second can listen for data sent using HTTP requests (HTTP GET or RESTful).
Leveraging this new REST API support in EPA, The CA APM MongoDB Collector integrates MongoDB metrics into CA APM for intelligent analytics, alerting and visibility in a single dashboard.
MongoDB Monitoring Metrics
There are many things that can impact the performance of MongoDB Database and they should be monitored to minimize any potential downtime. Degraded performance in MongoDB is typically a function of the relationship between the quantity of data stored in the database, the amount of system RAM, the number of connections to the database, and the amount of time the database spends in a locked state. In some cases performance issues may be transient and related to traffic load, data access patterns, or the availability of hardware on the host system for virtualized environments. Some users also experience performance limitations as a result of inadequate or inappropriate indexing strategies, or as a consequence of poor schema design patterns. In other situations, performance issues may indicate that the database may be operating at capacity and that it is time to add additional capacity to the database.
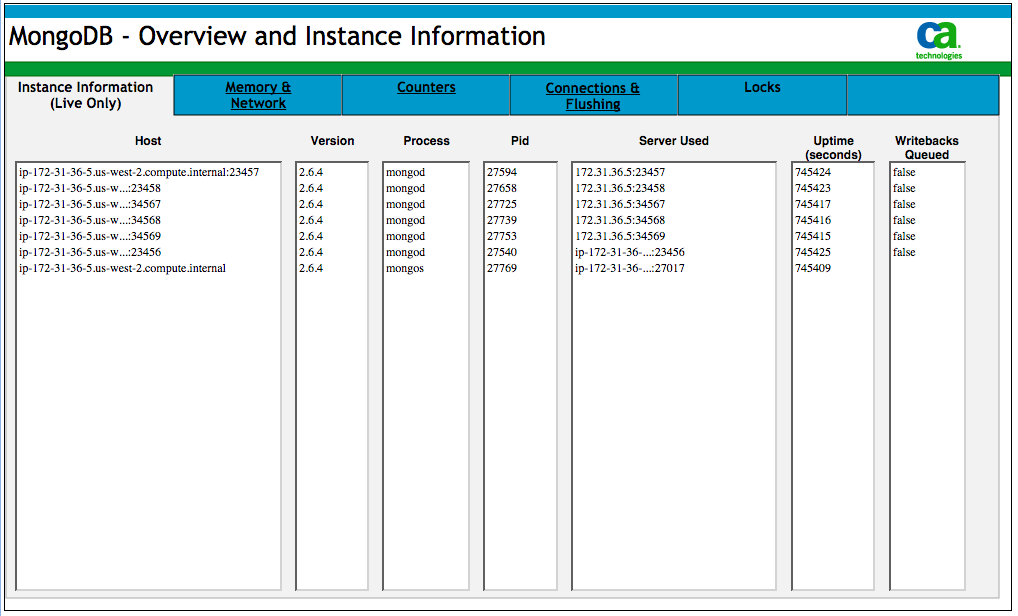
Here are some of the key metrics monitored via CA APM MongoDB Collector to ensure optimal MongoDB performance:
Memory and Networks
MongoDB uses memory mapped files to store data. Given a data set of sufficient size, the MongoDB process will allocate all available memory on the system for its use. While this is part of the design, and affords MongoDB superior performance, the memory mapped files make it difficult to determine if the amount of RAM is sufficient for the data set.
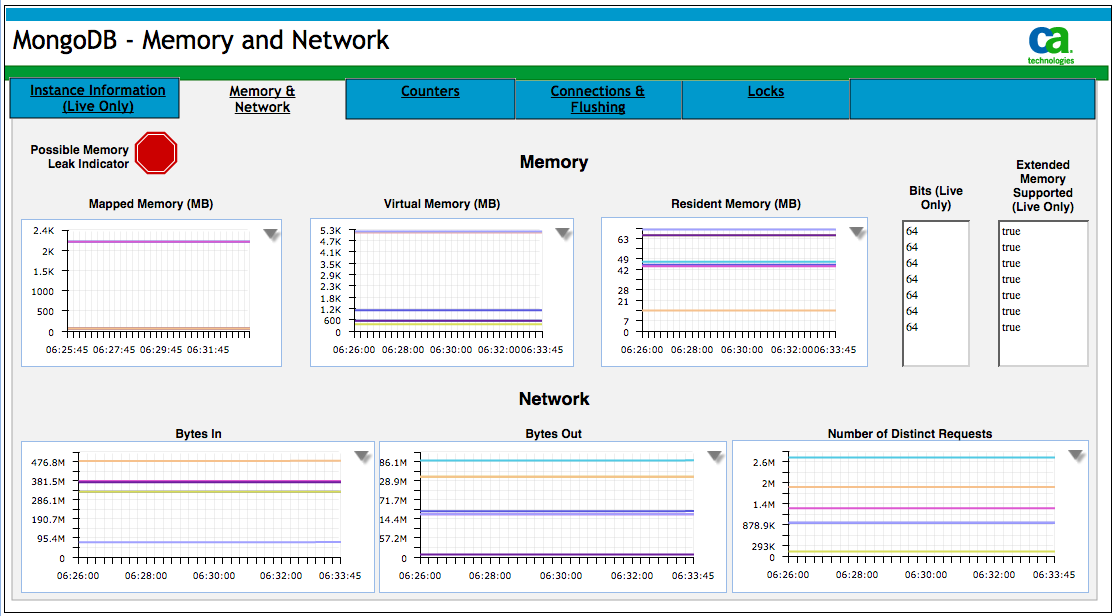
You will need to check the resident memory use (i.e. mem.resident): if this exceeds the amount of system memory and there is a significant amount of data on disk that isn’t in RAM, you may have exceeded the capacity of your system. You should also check the amount of mapped memory (i.e. mem.mapped.) If this value is greater than the amount of system memory, some operations will require disk access page faults to read data from virtual memory and negatively affect performance.
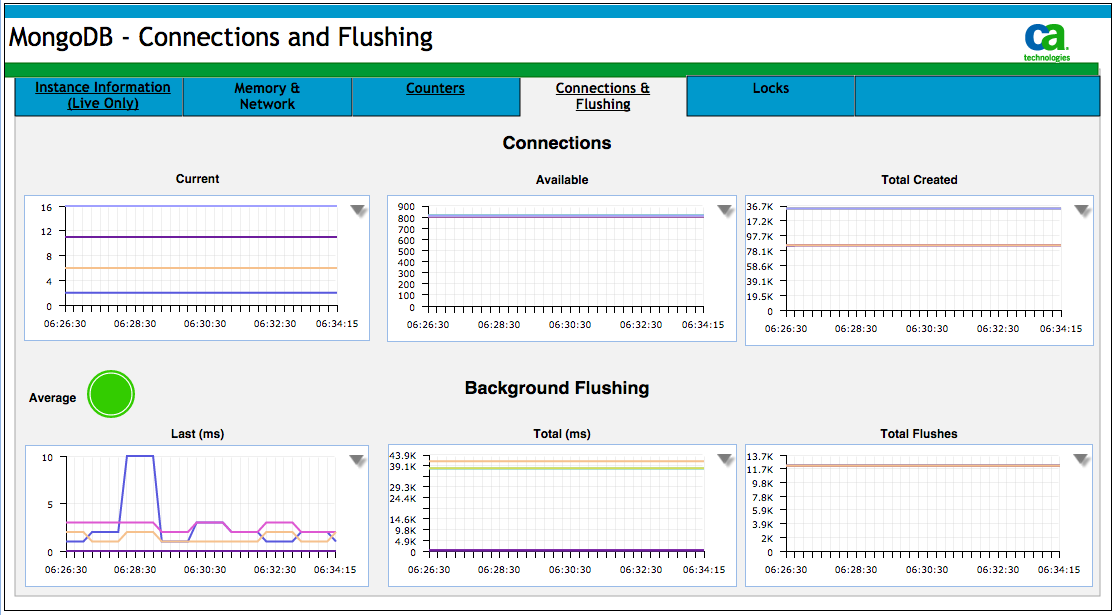
Connections and Flushing
In some cases, the number of connections between the application layer (i.e. clients) and the database can overwhelm the ability of the server to handle requests. This can produce performance irregularities. If requests are high because there are numerous concurrent application requests, the database may have trouble keeping up with demand. If this is the case, then you will need to increase the capacity of your deployment.
Locks
MongoDB uses a locking system to ensure data set consistency. However, if certain operations are long-running, or a queue forms, performance will slow as requests and operations wait for the lock. Lock-related slowdowns can be intermittent. To see if the lock has been affecting your performance, you will need to look at lock time. If it is consistently high, then there is a chance that a large number of requests are waiting for a lock. This indicates a possible concurrency issue that may be affecting performance. If Total Time is high relative to uptime, the database has existed in a lock state for a significant amount of time. Longer Total lock time may also mean that MongoDB has likely been processing a large number of long running queries. Long queries are often the result of a number of factors: ineffective use of indexes, non-optimal schema design, poor query structure, system architecture issues, or insufficient RAM resulting in page faults and disk reads.

We're posting this collector to GitHub to provide you with a great ready-working example of collector using the newly announced RESTFull API support CA APM EPA . Leveraging this you can build similar collectors for all sorts of applications you may want to monitor via CA APM.
To learn more, you can download the joint MongoDB and CA Technologies Solution brief by going to MongoDB certified partner web page .
--------------------------------------------------------------------------------------
Twelve (12/19)
Eleven (12/18)
Ten (12/17)
Nine Node.js Monitoring (12/16)
Eight PHP Monitoring (12/15)
Seven CA UIM Integration (12/14)
Six MongoDB Monitoring (12/13)
FIVE Rich Email Notifications with Contextual Data (12/12)
Four Smart Instrumentation (12/11)
Three Mobile App Analytics (12/10)
Two APM Command Center (12/9)
and an E.P.I.C APM Strategy (12/8)
--------------------------------------------------------------------------------------